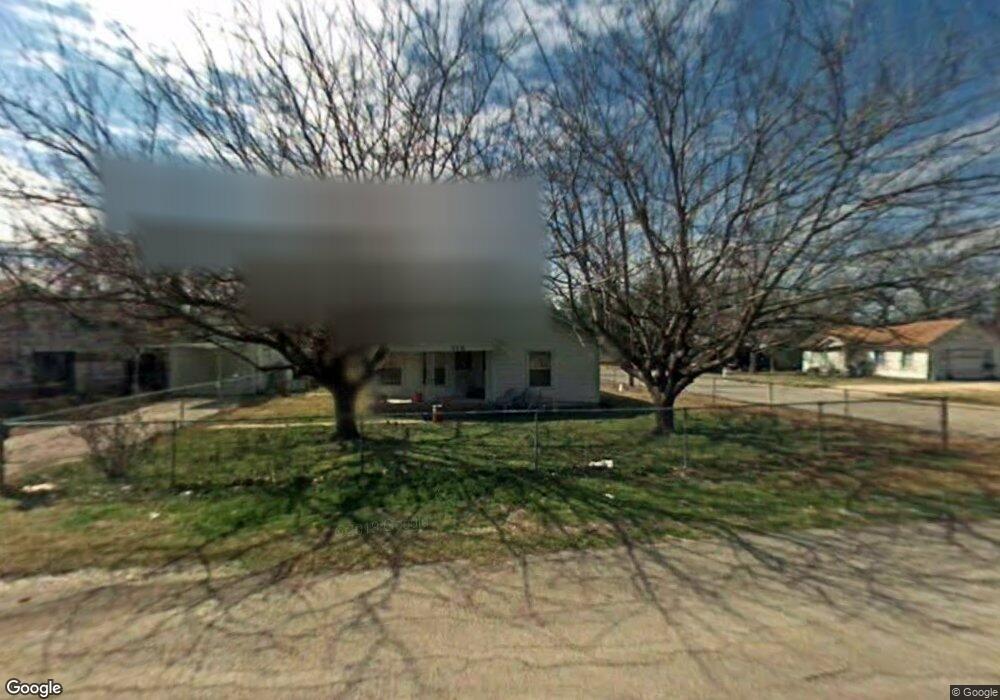
113 Hickory St Cleburne, TX 76033
Estimated Value: $132,547 - $175,000
2
Beds
1
Bath
896
Sq Ft
$174/Sq Ft
Est. Value
About This Home
This home is located at 113 Hickory St, Cleburne, TX 76033 and is currently estimated at $155,887, approximately $173 per square foot. 113 Hickory St is a home located in Johnson County with nearby schools including Cooke Elementary School, A.D. Wheat Middle School, and Cleburne High School.
Ownership History
Date
Name
Owned For
Owner Type
Purchase Details
Closed on
Aug 7, 2023
Sold by
Rendon Tammy
Bought by
Free Intuition Llc
Current Estimated Value
Purchase Details
Closed on
Jul 31, 2023
Sold by
Rendon Tammy
Bought by
Free Intuition Llc
Purchase Details
Closed on
Jul 27, 2023
Sold by
Rendon Mario G and Rendon Tammy
Bought by
Free Intuition Llc
Purchase Details
Closed on
Dec 2, 2015
Sold by
Brownrigg Robert M and Estate Of Don Michael Brannan
Bought by
Emerald Dolphin Ent Inc
Purchase Details
Closed on
Aug 24, 2009
Sold by
Robbins Jackie
Bought by
Rendon Mario and Rendon Tammy
Purchase Details
Closed on
Jun 15, 2007
Sold by
Choice Homes Inc
Bought by
Littlejohn Adam R and Littlejohn Michelle R
Home Financials for this Owner
Home Financials are based on the most recent Mortgage that was taken out on this home.
Original Mortgage
$122,887
Interest Rate
6.16%
Mortgage Type
Purchase Money Mortgage
Create a Home Valuation Report for This Property
The Home Valuation Report is an in-depth analysis detailing your home's value as well as a comparison with similar homes in the area
Home Values in the Area
Average Home Value in this Area
Purchase History
| Date | Buyer | Sale Price | Title Company |
|---|---|---|---|
| Free Intuition Llc | -- | None Listed On Document | |
| Free Intuition Llc | -- | None Listed On Document | |
| Free Intuition Llc | -- | None Listed On Document | |
| Free Intuition Llc | -- | None Listed On Document | |
| Emerald Dolphin Ent Inc | -- | Capital Title | |
| Rendon Mario | -- | None Available | |
| Littlejohn Adam R | -- | Fatco |
Source: Public Records
Mortgage History
| Date | Status | Borrower | Loan Amount |
|---|---|---|---|
| Previous Owner | Littlejohn Adam R | $122,887 |
Source: Public Records
Tax History
| Year | Tax Paid | Tax Assessment Tax Assessment Total Assessment is a certain percentage of the fair market value that is determined by local assessors to be the total taxable value of land and additions on the property. | Land | Improvement |
|---|---|---|---|---|
| 2025 | $2,121 | $95,114 | $39,000 | $56,114 |
| 2024 | $2,121 | $95,114 | $39,000 | $56,114 |
| 2023 | $1,872 | $84,114 | $28,000 | $56,114 |
| 2022 | $2,105 | $84,114 | $28,000 | $56,114 |
| 2021 | $2,195 | $84,114 | $28,000 | $56,114 |
| 2020 | $1,581 | $57,048 | $20,000 | $37,048 |
| 2019 | $1,686 | $57,048 | $20,000 | $37,048 |
| 2018 | $1,164 | $39,365 | $13,000 | $26,365 |
| 2017 | $1,159 | $39,365 | $13,000 | $26,365 |
| 2016 | $831 | $28,240 | $11,500 | $16,740 |
| 2015 | $422 | $28,240 | $11,500 | $16,740 |
| 2014 | $422 | $15,849 | $8,500 | $7,349 |
Source: Public Records
Map
Nearby Homes
- 604 Poindexter Ave
- 103 Myers Ave
- 700 Poindexter Ave
- 910 Baird St
- 504 Bales St
- 807 Poindexter Ave
- 502 Madison St
- 603 Madison St
- 916 Poindexter Ave
- 411 Euclid St
- 618 Granbury St
- 918 N Main St
- 1304 N Wood St
- 108 Monroe St
- 709 N Buffalo Ave
- 718 Turner St
- 107 Scurlock Ave
- 104 Dixon St
- 1102 Poindexter Ave
- 1111 N Douglas Ave Unit Lot 2
- 603 W Lone Star Ave
- 109 Hickory St
- 515 W Lone Star Ave
- 107 Hickory St
- 606 W Lone Star Ave
- 513 W Lone Star Ave
- 512 W Lone Star Ave
- 608 W Lone Star Ave
- 105 Hickory St
- 1110 N Walnut St
- 106 Hickory St
- 511 W Lone Star Ave
- 610 W Lone Star Ave
- 611 W Lone Star Ave
- 1108 N Walnut St
- 510 W Lone Star Ave
- 104 Hickory St
- 508 W Lone Star Ave
- 614 W Lone Star Ave
- 509 W Lone Star Ave
Your Personal Tour Guide
Ask me questions while you tour the home.