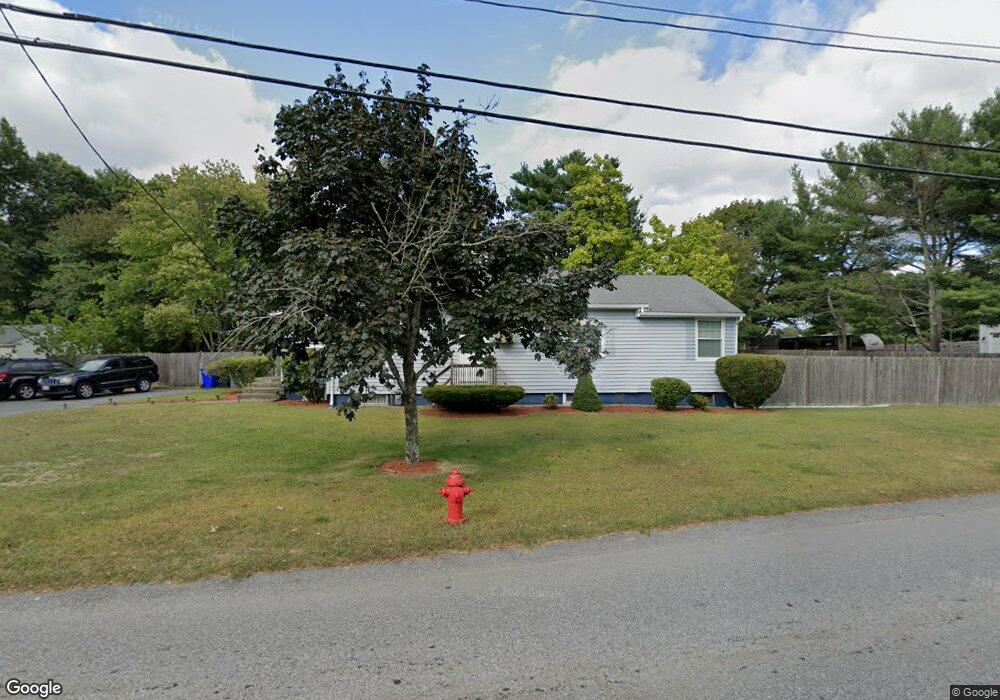
113 Highland St Taunton, MA 02780
Estimated Value: $449,000 - $522,000
3
Beds
1
Bath
1,196
Sq Ft
$402/Sq Ft
Est. Value
About This Home
This home is located at 113 Highland St, Taunton, MA 02780 and is currently estimated at $480,314, approximately $401 per square foot. 113 Highland St is a home located in Bristol County with nearby schools including Mulcahey Elementary School, Taunton High School, and Joseph H. Martin.
Ownership History
Date
Name
Owned For
Owner Type
Purchase Details
Closed on
Jan 31, 2003
Sold by
Giarrusso Carlo and Giarrusso Wilma
Bought by
Hathaway Alison M and Hathaway Mark R
Current Estimated Value
Home Financials for this Owner
Home Financials are based on the most recent Mortgage that was taken out on this home.
Original Mortgage
$197,000
Outstanding Balance
$85,231
Interest Rate
6.09%
Mortgage Type
Purchase Money Mortgage
Estimated Equity
$395,083
Purchase Details
Closed on
Jun 29, 2000
Sold by
Fredrickson Eric M and Fredrickson Tricia
Bought by
Giarrusso Wilma and Giarrusso Carlo
Home Financials for this Owner
Home Financials are based on the most recent Mortgage that was taken out on this home.
Original Mortgage
$142,000
Interest Rate
8.59%
Mortgage Type
Purchase Money Mortgage
Create a Home Valuation Report for This Property
The Home Valuation Report is an in-depth analysis detailing your home's value as well as a comparison with similar homes in the area
Home Values in the Area
Average Home Value in this Area
Purchase History
| Date | Buyer | Sale Price | Title Company |
|---|---|---|---|
| Hathaway Alison M | $248,400 | -- | |
| Giarrusso Wilma | $142,000 | -- |
Source: Public Records
Mortgage History
| Date | Status | Borrower | Loan Amount |
|---|---|---|---|
| Open | Hathaway Alison M | $197,000 | |
| Previous Owner | Giarrusso Wilma | $142,000 | |
| Previous Owner | Giarrusso Wilma | $124,200 | |
| Previous Owner | Giarrusso Wilma | $14,000 | |
| Previous Owner | Giarrusso Wilma | $21,200 |
Source: Public Records
Tax History Compared to Growth
Tax History
| Year | Tax Paid | Tax Assessment Tax Assessment Total Assessment is a certain percentage of the fair market value that is determined by local assessors to be the total taxable value of land and additions on the property. | Land | Improvement |
|---|---|---|---|---|
| 2025 | $4,201 | $384,000 | $135,600 | $248,400 |
| 2024 | $3,944 | $352,500 | $135,600 | $216,900 |
| 2023 | $3,964 | $329,000 | $141,800 | $187,200 |
| 2022 | $3,655 | $277,300 | $109,900 | $167,400 |
| 2021 | $3,475 | $244,700 | $99,900 | $144,800 |
| 2020 | $3,468 | $233,400 | $99,900 | $133,500 |
| 2019 | $3,522 | $223,500 | $99,900 | $123,600 |
| 2018 | $3,309 | $210,500 | $100,900 | $109,600 |
| 2017 | $3,181 | $202,500 | $95,700 | $106,800 |
| 2016 | $3,087 | $196,900 | $92,900 | $104,000 |
| 2015 | $2,945 | $196,200 | $91,900 | $104,300 |
| 2014 | $2,826 | $193,400 | $91,900 | $101,500 |
Source: Public Records
Map
Nearby Homes
- 125 Highland St Unit 103
- 50 Highland St Unit 135
- 65 Bridget Dr
- 193 Winthrop St
- 173 Highland St Unit 201
- 170 Highland St Unit 320
- 170 Highland St Unit 119
- 1 Everett St
- 133 Winthrop St
- 72 Barnum St
- 410 Warner Blvd Unit A
- 4 A Lawton St Unit A
- 58 Lawton St
- 450 Somerset Ave Unit 6-6
- 15 Shetland Rd
- 75 Wales St
- 278 Cohannet St
- 39 Myrtle St
- 321 Winthrop St Unit 109
- 24 1st St