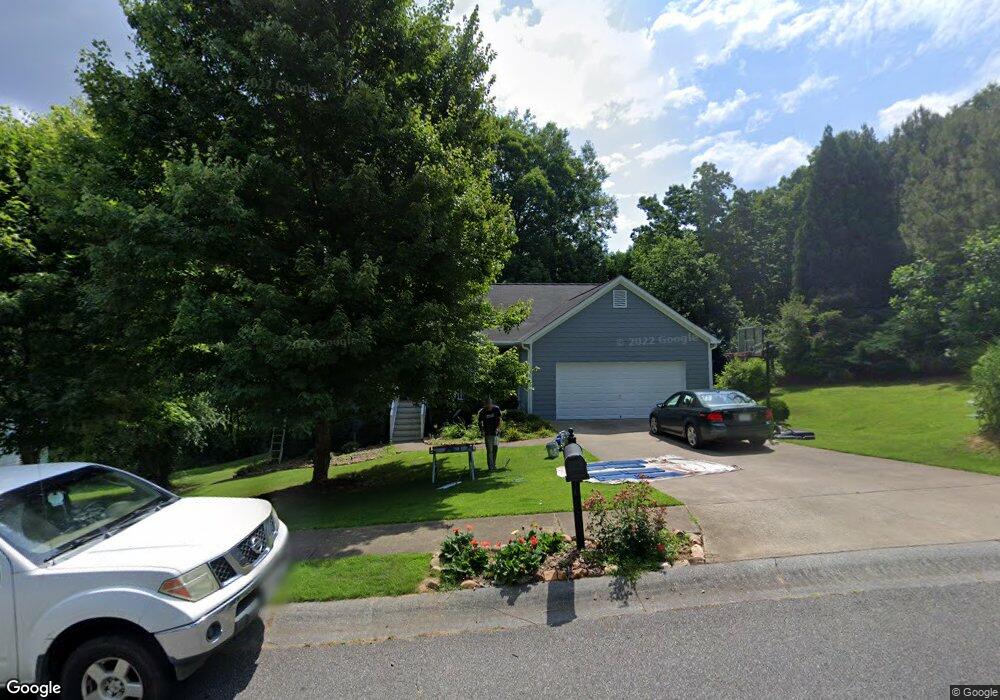
113 Highland View Pass White, GA 30184
Sutallee NeighborhoodEstimated Value: $435,000 - $438,826
3
Beds
2
Baths
1,958
Sq Ft
$223/Sq Ft
Est. Value
About This Home
This home is located at 113 Highland View Pass, White, GA 30184 and is currently estimated at $436,913, approximately $223 per square foot. 113 Highland View Pass is a home located in Cherokee County with nearby schools including J. Knox Elementary School, Teasley Middle School, and Cherokee High School.
Ownership History
Date
Name
Owned For
Owner Type
Purchase Details
Closed on
Apr 30, 2008
Sold by
Mcneil Jeffry D and Mcneil Julie H
Bought by
Christian Kenneth D and Christian Lori A
Current Estimated Value
Home Financials for this Owner
Home Financials are based on the most recent Mortgage that was taken out on this home.
Original Mortgage
$193,857
Outstanding Balance
$121,417
Interest Rate
5.84%
Mortgage Type
FHA
Estimated Equity
$315,496
Purchase Details
Closed on
Oct 31, 2000
Sold by
Custom One Homes Llc
Bought by
Mcneil Jeffrey D and Mcneil Julie H
Home Financials for this Owner
Home Financials are based on the most recent Mortgage that was taken out on this home.
Original Mortgage
$149,850
Interest Rate
7.93%
Mortgage Type
New Conventional
Create a Home Valuation Report for This Property
The Home Valuation Report is an in-depth analysis detailing your home's value as well as a comparison with similar homes in the area
Home Values in the Area
Average Home Value in this Area
Purchase History
| Date | Buyer | Sale Price | Title Company |
|---|---|---|---|
| Christian Kenneth D | $196,900 | -- | |
| Mcneil Jeffrey D | $154,500 | -- |
Source: Public Records
Mortgage History
| Date | Status | Borrower | Loan Amount |
|---|---|---|---|
| Open | Christian Kenneth D | $193,857 | |
| Previous Owner | Mcneil Jeffrey D | $149,850 |
Source: Public Records
Tax History Compared to Growth
Tax History
| Year | Tax Paid | Tax Assessment Tax Assessment Total Assessment is a certain percentage of the fair market value that is determined by local assessors to be the total taxable value of land and additions on the property. | Land | Improvement |
|---|---|---|---|---|
| 2025 | $3,373 | $144,920 | $29,200 | $115,720 |
| 2024 | $3,946 | $173,356 | $29,200 | $144,156 |
| 2023 | $3,426 | $146,716 | $24,000 | $122,716 |
| 2022 | $2,966 | $125,080 | $24,000 | $101,080 |
| 2021 | $2,842 | $109,080 | $19,200 | $89,880 |
| 2020 | $2,476 | $93,200 | $17,600 | $75,600 |
| 2019 | $2,251 | $83,520 | $17,600 | $65,920 |
| 2018 | $2,237 | $82,440 | $17,600 | $64,840 |
| 2017 | $2,062 | $185,500 | $14,400 | $59,800 |
| 2016 | $2,013 | $178,600 | $14,400 | $57,040 |
| 2015 | $1,945 | $171,100 | $12,800 | $55,640 |
| 2014 | $1,948 | $171,100 | $13,800 | $54,640 |
Source: Public Records
Map
Nearby Homes
- 132 Amberleigh Dr
- 302 Amberleigh Ct
- 875 Knox Bridge Hwy
- 427 Spring Lake Hills
- 128 Brookfield Ct SE
- 2841 Upper Sweetwater Trail SE
- 315 Rhine Rd SE
- 1355 White Rd
- 220 Wilshire Terrace
- 206 Ficklen Dr
- 227 Wilshire Terrace
- 324 Sutallee Place
- 27 Rose Brooke Cir
- 1045 Fincher Rd
- 2307 Ellie Way
- 1 Cason Dr
- 933 Mount Carmel Church Ln
- 1011 Mount Carmel Church Ln
- 10 Clydesdale Trail
- 16 Hawks Branch Ln
- 115 Highland View Pass
- 111 Highland View Pass Unit 6
- 111 Highland View Pass Unit 1
- 109 Highland View Pass
- 117 Highland View Pass
- 112 Highland View Pass
- 409 Maple Ridge
- 407 Maple Ridge
- 107 Highland View Pass
- 114 Highland View Pass Unit 1
- 110 Highland View Pass Unit 1
- 119 Highland View Pass
- 411 Maple Ridge
- 405 Maple Ridge
- 201 Highland View Pass
- 121 Highland View Pass
- 200 Oak Hollow Ct
- 105 Highland View Pass
- 403 Maple Ridge
- 116 Highland View Pass