Estimated Value: $147,000 - $161,000
--
Bed
1
Bath
914
Sq Ft
$170/Sq Ft
Est. Value
About This Home
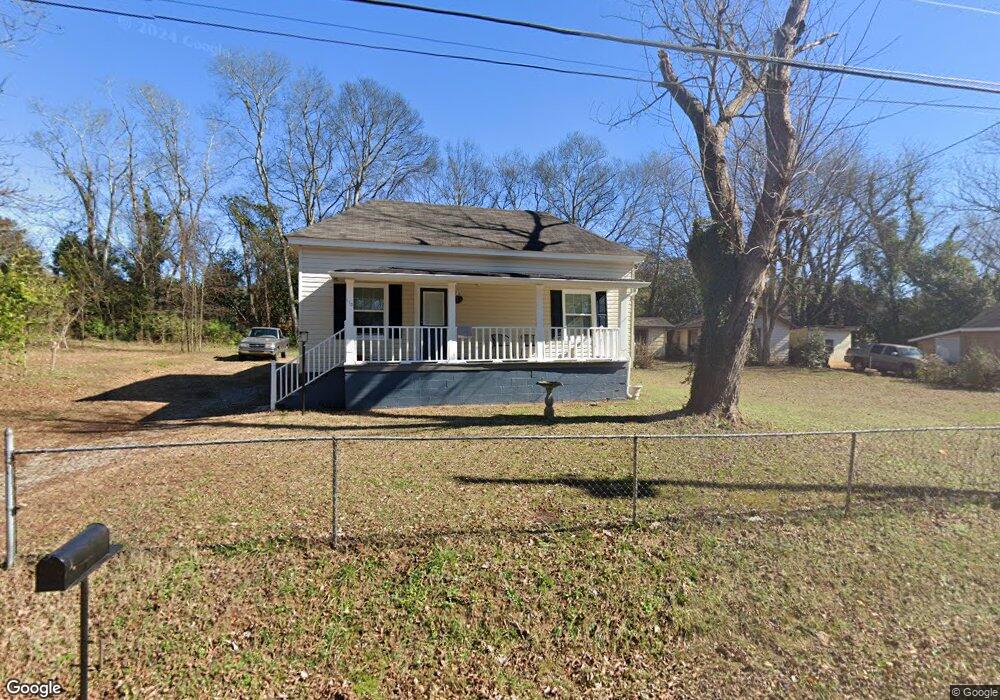
This home is located at 113 Hosea St SW, Rome, GA 30161 and is currently estimated at $155,474, approximately $170 per square foot. 113 Hosea St SW is a home located in Floyd County with nearby schools including Dan McCarty Middle School, Rome High School, and St. Mary School.
Ownership History
Date
Name
Owned For
Owner Type
Purchase Details
Closed on
Aug 24, 2023
Sold by
Edwards Terry
Bought by
Mutter Anthony
Current Estimated Value
Home Financials for this Owner
Home Financials are based on the most recent Mortgage that was taken out on this home.
Original Mortgage
$152,192
Outstanding Balance
$148,839
Interest Rate
6.99%
Mortgage Type
FHA
Estimated Equity
$6,635
Purchase Details
Closed on
Apr 27, 2022
Sold by
Justice Kenny Odell
Bought by
Edwards Terry
Purchase Details
Closed on
Dec 30, 1997
Sold by
Justice Lucille
Bought by
Justice Kenny O'Dell
Purchase Details
Closed on
Jan 1, 1994
Sold by
P\R
Bought by
Justice Lucille
Purchase Details
Closed on
Jan 26, 1981
Sold by
Hibbert Charley and Hibbert Margaret S
Bought by
P\R
Purchase Details
Closed on
Sep 16, 1977
Sold by
Covington Dean and Keown Hugh
Bought by
Keown Hugh
Purchase Details
Closed on
Sep 26, 1975
Sold by
Keown Hugh
Bought by
Hibbert Charley and Hibbert Margaret S
Purchase Details
Closed on
Sep 16, 1962
Bought by
Covington Dean and Keown Hugh
Create a Home Valuation Report for This Property
The Home Valuation Report is an in-depth analysis detailing your home's value as well as a comparison with similar homes in the area
Home Values in the Area
Average Home Value in this Area
Purchase History
| Date | Buyer | Sale Price | Title Company |
|---|---|---|---|
| Mutter Anthony | $155,000 | -- | |
| Edwards Terry | $29,000 | -- | |
| Justice Kenny O'Dell | -- | -- | |
| Justice Lucille | $40,000 | -- | |
| P\R | $7,600 | -- | |
| Keown Hugh | $9,500 | -- | |
| Hibbert Charley | -- | -- | |
| Covington Dean | -- | -- |
Source: Public Records
Mortgage History
| Date | Status | Borrower | Loan Amount |
|---|---|---|---|
| Open | Mutter Anthony | $152,192 |
Source: Public Records
Tax History Compared to Growth
Tax History
| Year | Tax Paid | Tax Assessment Tax Assessment Total Assessment is a certain percentage of the fair market value that is determined by local assessors to be the total taxable value of land and additions on the property. | Land | Improvement |
|---|---|---|---|---|
| 2024 | $2,052 | $58,733 | $4,805 | $53,928 |
| 2023 | $675 | $19,219 | $4,368 | $14,851 |
| 2022 | $574 | $15,718 | $3,494 | $12,224 |
| 2021 | $535 | $14,412 | $3,494 | $10,918 |
| 2020 | $486 | $12,979 | $2,730 | $10,249 |
| 2019 | $456 | $12,326 | $2,730 | $9,596 |
| 2018 | $428 | $11,559 | $2,730 | $8,829 |
| 2017 | $414 | $11,184 | $2,730 | $8,454 |
| 2016 | $406 | $10,941 | $2,720 | $8,221 |
| 2015 | $384 | $10,941 | $2,720 | $8,221 |
| 2014 | $384 | $10,941 | $2,720 | $8,221 |
Source: Public Records
Map
Nearby Homes
- 111 Hosea St SW
- 14 Clover St SW
- 2014 Maple Ave SW
- 1705 Olmstead St SW
- 2108 Maple Ave SW
- 414 E 17th St SW
- 304 E 19th St SW
- 000 E Oglethorpe Hwy
- 2107 Rockmart Rd SE
- 1502 Spring Creek St SW
- 1901 Hull Ave SW
- 107 E Linden St SE
- 4 E 15th St SW
- 2512 Callier Springs Rd SE
- 39 E 16th St SW
- 1314 E 2nd Ave SE
- 2501 Maple Rd SE
- 1 Joe Louis Blvd SE
- 79 Chateau Dr SE
- 117 Hosea St SW
- 112 Hosea St SW
- 110 Hosea St SW
- 114 Hosea St SW
- 108 Hosea St SW
- 119 Hosea St SW
- 116 Hosea St SW
- 121 Hosea St SW
- 106 Hosea St SW
- 118 Hosea St SW
- 2009 Flannery St SW
- 2011 Flannery St SW
- 2005 Flannery St SW
- 2007 Flannery St SW
- 2013 Flannery St SW
- 104 Hosea St SW
- 2015 Flannery St SW
- 2003 Flannery St SW
- 102 Hosea St SW
- 502 E 20th St SW