T
Seller's Agent in 2025
Tammy Fielding
KeySouth Real Estate Group, Inc
(305) 595-7355
12 Total Sales
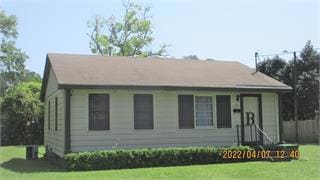
This home is located at 113 James St, Thomasville, GA 31792 and is currently priced at $125,000, approximately $161 per square foot. This property was built in 1951. 113 James St is a home located in Thomas County with nearby schools including Thomasville High School, Bishop Hall Charter School, and Rescue Mission Christian School.
Last Agent to Sell the Property
KeySouth Real Estate Group, Inc Brokerage Phone: 2292263911 License #411116 Listed on: 09/12/2025

| Date | Type | Sale Price | Title Company |
|---|---|---|---|
| Limited Warranty Deed | $125,000 | -- | |
| Deed | -- | -- | |
| Deed | -- | -- | |
| Deed | -- | -- |
| Date | Status | Loan Amount | Loan Type |
|---|---|---|---|
| Open | $125,000 | Future Advance Clause Open End Mortgage |
| Date | Event | Price | List to Sale | Price per Sq Ft |
|---|---|---|---|---|
| 11/14/2025 11/14/25 | Sold | $125,000 | 0.0% | $161 / Sq Ft |
| 10/15/2025 10/15/25 | Pending | -- | -- | -- |
| 09/12/2025 09/12/25 | For Sale | $125,000 | -- | $161 / Sq Ft |
| Year | Tax Paid | Tax Assessment Tax Assessment Total Assessment is a certain percentage of the fair market value that is determined by local assessors to be the total taxable value of land and additions on the property. | Land | Improvement |
|---|---|---|---|---|
| 2025 | $445 | $26,718 | $4,970 | $21,748 |
| 2024 | $439 | $26,077 | $4,970 | $21,107 |
| 2023 | $308 | $20,227 | $4,970 | $15,257 |
| 2022 | $133 | $17,573 | $4,260 | $13,313 |
| 2021 | $126 | $15,606 | $4,260 | $11,346 |
| 2020 | $127 | $15,412 | $4,260 | $11,152 |
| 2019 | $132 | $15,800 | $4,260 | $11,540 |
| 2018 | $131 | $15,591 | $4,260 | $11,331 |
| 2017 | $131 | $15,311 | $3,792 | $11,519 |
| 2016 | $131 | $15,256 | $3,792 | $11,465 |
| 2015 | $144 | $16,402 | $3,536 | $12,866 |
| 2014 | $142 | $16,141 | $3,536 | $12,605 |
| 2013 | -- | $16,141 | $3,536 | $12,605 |
T
Seller's Agent in 2025
Tammy Fielding
KeySouth Real Estate Group, Inc
(305) 595-7355
12 Total Sales
Buyer's Agent in 2025
Russ Taylor
KeySouth Real Estate Group, Inc
(229) 224-6858
79 Total Sales
Source: Thomasville Area Board of REALTORS®
MLS Number: 926210
APN: 010-005011
Ask me questions while you tour the home.