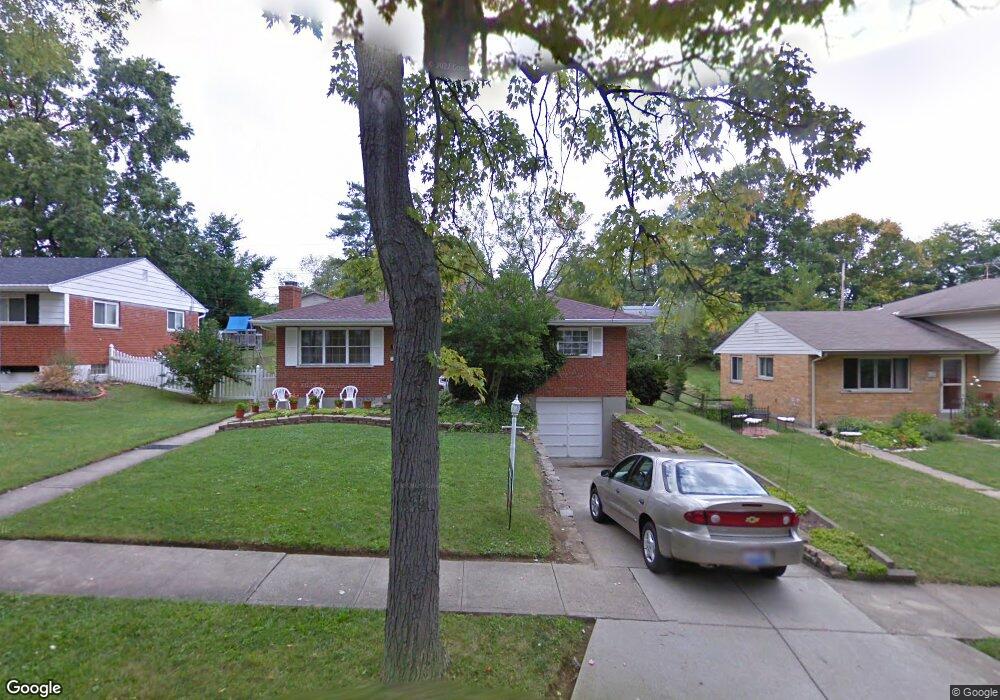
113 Julep Ln Cincinnati, OH 45218
Estimated Value: $239,000 - $285,000
3
Beds
3
Baths
1,695
Sq Ft
$150/Sq Ft
Est. Value
About This Home
This home is located at 113 Julep Ln, Cincinnati, OH 45218 and is currently estimated at $254,981, approximately $150 per square foot. 113 Julep Ln is a home located in Hamilton County with nearby schools including Calvary Academy- The.
Ownership History
Date
Name
Owned For
Owner Type
Purchase Details
Closed on
Dec 17, 1997
Sold by
Tavaladi Nahid L and Tavaladi Mohammad J
Bought by
Tavalali Behnam and Tavalali Nahid L
Current Estimated Value
Home Financials for this Owner
Home Financials are based on the most recent Mortgage that was taken out on this home.
Original Mortgage
$94,611
Outstanding Balance
$13,808
Interest Rate
7.24%
Mortgage Type
FHA
Estimated Equity
$241,173
Purchase Details
Closed on
Mar 21, 1997
Sold by
Laknahour Mohammad and Laknahour Fatemeh G
Bought by
Laknahour Mohammad J and Tavalali Nahid L
Purchase Details
Closed on
Nov 1, 1996
Sold by
Howard Seth and Howard Dawn D
Bought by
Laknahour Mohammad and Tavalali Nahid
Home Financials for this Owner
Home Financials are based on the most recent Mortgage that was taken out on this home.
Original Mortgage
$65,000
Interest Rate
8.26%
Create a Home Valuation Report for This Property
The Home Valuation Report is an in-depth analysis detailing your home's value as well as a comparison with similar homes in the area
Home Values in the Area
Average Home Value in this Area
Purchase History
| Date | Buyer | Sale Price | Title Company |
|---|---|---|---|
| Tavalali Behnam | -- | -- | |
| Laknahour Mohammad J | -- | -- | |
| Laknahour Mohammad | $92,000 | -- |
Source: Public Records
Mortgage History
| Date | Status | Borrower | Loan Amount |
|---|---|---|---|
| Open | Tavalali Behnam | $94,611 | |
| Previous Owner | Laknahour Mohammad | $65,000 |
Source: Public Records
Tax History
| Year | Tax Paid | Tax Assessment Tax Assessment Total Assessment is a certain percentage of the fair market value that is determined by local assessors to be the total taxable value of land and additions on the property. | Land | Improvement |
|---|---|---|---|---|
| 2025 | $4,844 | $66,952 | $10,374 | $56,578 |
| 2024 | $4,467 | $66,952 | $10,374 | $56,578 |
| 2023 | $4,166 | $66,952 | $10,374 | $56,578 |
| 2022 | $3,895 | $46,708 | $8,050 | $38,658 |
| 2021 | $3,815 | $46,708 | $8,050 | $38,658 |
| 2020 | $3,870 | $46,708 | $8,050 | $38,658 |
| 2019 | $3,763 | $39,921 | $6,881 | $33,040 |
| 2018 | $3,771 | $39,921 | $6,881 | $33,040 |
| 2017 | $3,495 | $39,921 | $6,881 | $33,040 |
| 2016 | $3,263 | $36,386 | $7,434 | $28,952 |
| 2015 | $3,065 | $36,386 | $7,434 | $28,952 |
| 2014 | $3,137 | $36,386 | $7,434 | $28,952 |
| 2013 | $3,314 | $39,551 | $8,082 | $31,469 |
Source: Public Records
Map
Nearby Homes
- 1 Jennings Rd
- 16 Japonica Dr
- 38 Handel Ln
- 34 Gambier Cir
- 29 Dayspring Terrace
- 37 Hayden Dr
- 31 Flanders Ln
- 11 Dewitt Ct
- 9 Dewitt Ct
- 7 Dewitt Ct
- 6 Chalmers Ct
- 1105 Inner Circle Dr
- 48 Damon Rd
- 1013 Ligorio Ave
- 11 Ashby St
- 920 Waycross Rd
- 602 Brightview Place Unit 34
- 612 Brightview Place Unit 30
- 614 Brightview Place Unit 29
- 626 Brightview Place Unit 24
Your Personal Tour Guide
Ask me questions while you tour the home.