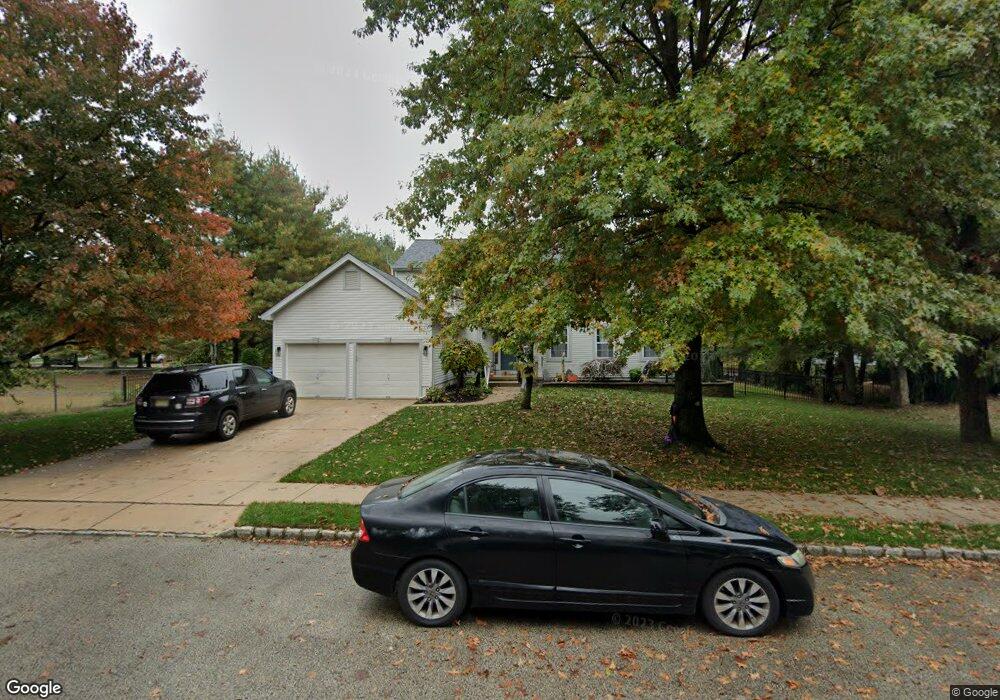
113 Leas Ln Burlington, NJ 08016
Estimated Value: $604,000 - $645,000
4
Beds
3
Baths
2,516
Sq Ft
$248/Sq Ft
Est. Value
About This Home
This home is located at 113 Leas Ln, Burlington, NJ 08016 and is currently estimated at $624,455, approximately $248 per square foot. 113 Leas Ln is a home located in Burlington County with nearby schools including B Bernice Young Elementary School, Fountain Woods Elementary School, and Burlington Township Middle School at Springside.
Ownership History
Date
Name
Owned For
Owner Type
Purchase Details
Closed on
Oct 30, 2015
Sold by
Renna Nicholas and Renna Emily
Bought by
Renna Nicholas and Renna Emily
Current Estimated Value
Home Financials for this Owner
Home Financials are based on the most recent Mortgage that was taken out on this home.
Original Mortgage
$308,250
Outstanding Balance
$126,819
Interest Rate
3.87%
Mortgage Type
New Conventional
Estimated Equity
$497,636
Purchase Details
Closed on
Jun 30, 2009
Sold by
Williams Steven A and Williams Donna A
Bought by
Renna Nicholas and Berton Emily
Home Financials for this Owner
Home Financials are based on the most recent Mortgage that was taken out on this home.
Original Mortgage
$345,624
Interest Rate
5.31%
Mortgage Type
FHA
Purchase Details
Closed on
Sep 30, 1999
Sold by
Paparone Homes Of New Jersey Inc
Bought by
Williams Steven A and Williams Donna A
Create a Home Valuation Report for This Property
The Home Valuation Report is an in-depth analysis detailing your home's value as well as a comparison with similar homes in the area
Home Values in the Area
Average Home Value in this Area
Purchase History
| Date | Buyer | Sale Price | Title Company |
|---|---|---|---|
| Renna Nicholas | -- | Diversified Settlement Svcs | |
| Renna Nicholas | $352,000 | Foundation Title | |
| Williams Steven A | $184,725 | First American Title Ins Co |
Source: Public Records
Mortgage History
| Date | Status | Borrower | Loan Amount |
|---|---|---|---|
| Open | Renna Nicholas | $308,250 | |
| Closed | Renna Nicholas | $345,624 |
Source: Public Records
Tax History Compared to Growth
Tax History
| Year | Tax Paid | Tax Assessment Tax Assessment Total Assessment is a certain percentage of the fair market value that is determined by local assessors to be the total taxable value of land and additions on the property. | Land | Improvement |
|---|---|---|---|---|
| 2025 | $9,490 | $313,000 | $78,400 | $234,600 |
| 2024 | $9,349 | $313,000 | $78,400 | $234,600 |
| 2023 | $9,349 | $313,000 | $78,400 | $234,600 |
| 2022 | $9,309 | $313,000 | $78,400 | $234,600 |
| 2021 | $9,403 | $313,000 | $78,400 | $234,600 |
| 2020 | $9,381 | $313,000 | $78,400 | $234,600 |
| 2019 | $9,403 | $313,000 | $78,400 | $234,600 |
| 2018 | $9,262 | $313,000 | $78,400 | $234,600 |
| 2017 | $9,205 | $313,000 | $78,400 | $234,600 |
| 2016 | $10,650 | $355,000 | $77,100 | $277,900 |
| 2015 | $10,465 | $355,000 | $77,100 | $277,900 |
| 2014 | $10,082 | $355,000 | $77,100 | $277,900 |
Source: Public Records
Map
Nearby Homes