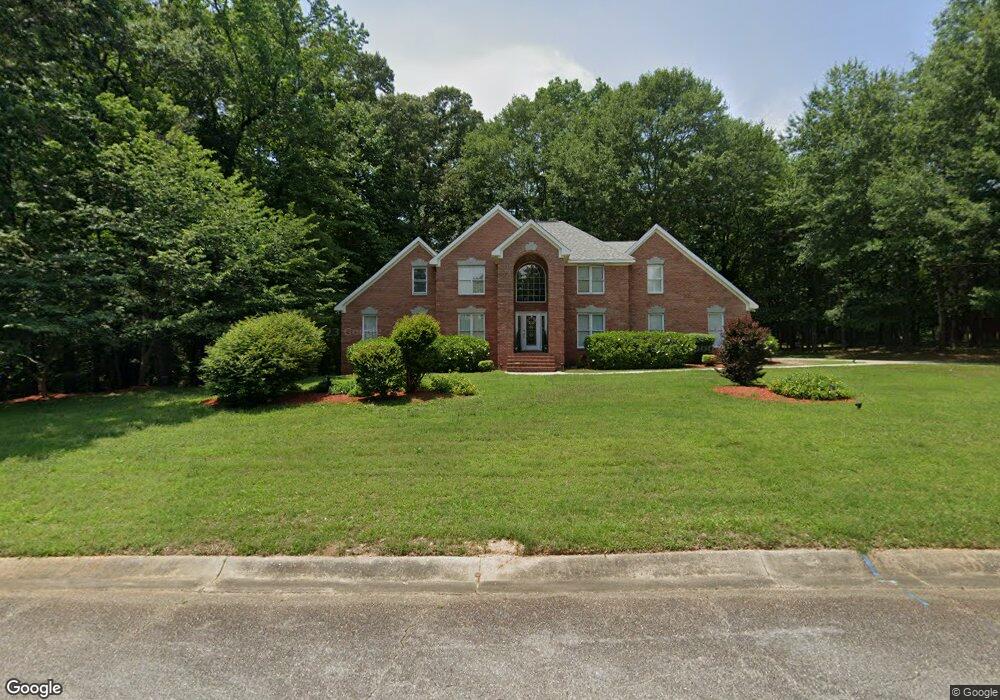
113 Lotus Point Dr Unit /14 Macon, GA 31220
Estimated Value: $386,348 - $468,000
5
Beds
4
Baths
2,722
Sq Ft
$161/Sq Ft
Est. Value
About This Home
This home is located at 113 Lotus Point Dr Unit /14, Macon, GA 31220 and is currently estimated at $438,087, approximately $160 per square foot. 113 Lotus Point Dr Unit /14 is a home located in Bibb County with nearby schools including Heritage Elementary School, Weaver Middle School, and Westside High School.
Ownership History
Date
Name
Owned For
Owner Type
Purchase Details
Closed on
Oct 29, 2019
Sold by
Koch Calista Anne and Koch Kevin
Bought by
Rice Leroy and Rice Annie
Current Estimated Value
Home Financials for this Owner
Home Financials are based on the most recent Mortgage that was taken out on this home.
Original Mortgage
$274,783
Outstanding Balance
$241,180
Interest Rate
3.7%
Mortgage Type
VA
Estimated Equity
$196,907
Purchase Details
Closed on
Oct 26, 2012
Sold by
Waddy Calista Anne and Koch Calista Anne
Bought by
Koch Calista Anne and Koch Kevin
Home Financials for this Owner
Home Financials are based on the most recent Mortgage that was taken out on this home.
Original Mortgage
$178,793
Interest Rate
3.4%
Mortgage Type
New Conventional
Purchase Details
Closed on
Jan 31, 2011
Sold by
Waddy Ben Lee and Waddy Calista Anne
Bought by
Waddy Calista Anne
Purchase Details
Closed on
Jul 25, 2003
Bought by
Waddy Ben Lee and Waddy Calista A
Create a Home Valuation Report for This Property
The Home Valuation Report is an in-depth analysis detailing your home's value as well as a comparison with similar homes in the area
Home Values in the Area
Average Home Value in this Area
Purchase History
| Date | Buyer | Sale Price | Title Company |
|---|---|---|---|
| Rice Leroy | $269,000 | None Available | |
| Koch Calista Anne | -- | None Available | |
| Waddy Calista Anne | -- | None Available | |
| Waddy Ben Lee | $250,000 | -- |
Source: Public Records
Mortgage History
| Date | Status | Borrower | Loan Amount |
|---|---|---|---|
| Open | Rice Leroy | $274,783 | |
| Previous Owner | Koch Calista Anne | $178,793 |
Source: Public Records
Tax History Compared to Growth
Tax History
| Year | Tax Paid | Tax Assessment Tax Assessment Total Assessment is a certain percentage of the fair market value that is determined by local assessors to be the total taxable value of land and additions on the property. | Land | Improvement |
|---|---|---|---|---|
| 2025 | $2,930 | $133,820 | $21,700 | $112,120 |
| 2024 | $3,031 | $133,820 | $21,700 | $112,120 |
| 2023 | $2,764 | $133,820 | $21,700 | $112,120 |
| 2022 | $4,512 | $137,332 | $29,136 | $108,196 |
| 2021 | $4,255 | $118,969 | $19,424 | $99,545 |
| 2020 | $3,906 | $108,303 | $19,424 | $88,879 |
| 2019 | $4,240 | $108,303 | $19,424 | $88,879 |
| 2018 | $6,673 | $108,303 | $19,424 | $88,879 |
| 2017 | $4,058 | $108,303 | $19,424 | $88,879 |
| 2016 | $3,747 | $108,303 | $19,424 | $88,879 |
| 2015 | $5,304 | $108,303 | $19,424 | $88,879 |
| 2014 | $5,312 | $108,303 | $19,424 | $88,879 |
Source: Public Records
Map
Nearby Homes
- 324 Brim Dr
- 238 Hamrick Rd
- 1905 Johnson Rd
- 2204 Lake Haven Ct
- 2318 Gwendale Dr E
- 6806 Bay Point Dr
- 119 Springs Ct N
- 2420 Grand Habor Ct
- 2420 Grand Harbour Ct
- 349 Hillridge Cove
- 6671 Moseley Dixon Rd
- 2416 Grand Harbour Ct
- 2325 Grand Harbour Dr
- 2313 Grand Harbour Dr
- 2303 Grand Harbour Dr
- 2306 Grand Harbour Dr
- 2314 Grand Harbour Dr
- 2296 Lake Helen Ct
- 2285 Lake Helen Ct
- 2299 Lake Helen Ct
- 113 Lotus Point Dr
- 513 MacMillian Ln
- 512 MacMillian Ln
- 514 MacMillian Ln
- 236 Tulokee Ct
- 105 Lotus Point Dr
- 116 Lotus Point Dr
- 112 Lotus Point Dr
- 120 Lotus Point Dr
- 108 Lotus Point Dr
- 232 Tulokee Ct
- 124 Lotus Point Dr
- 103 Lotus Point Dr
- 121 Lotus Point Dr
- 224 Tulokee Ct
- 248 Tulokee Ct
- 104 Lotus Point Dr
- 247 Tulokee Ct
- 241 Tulokee Ct
- 235 Tulokee Ct