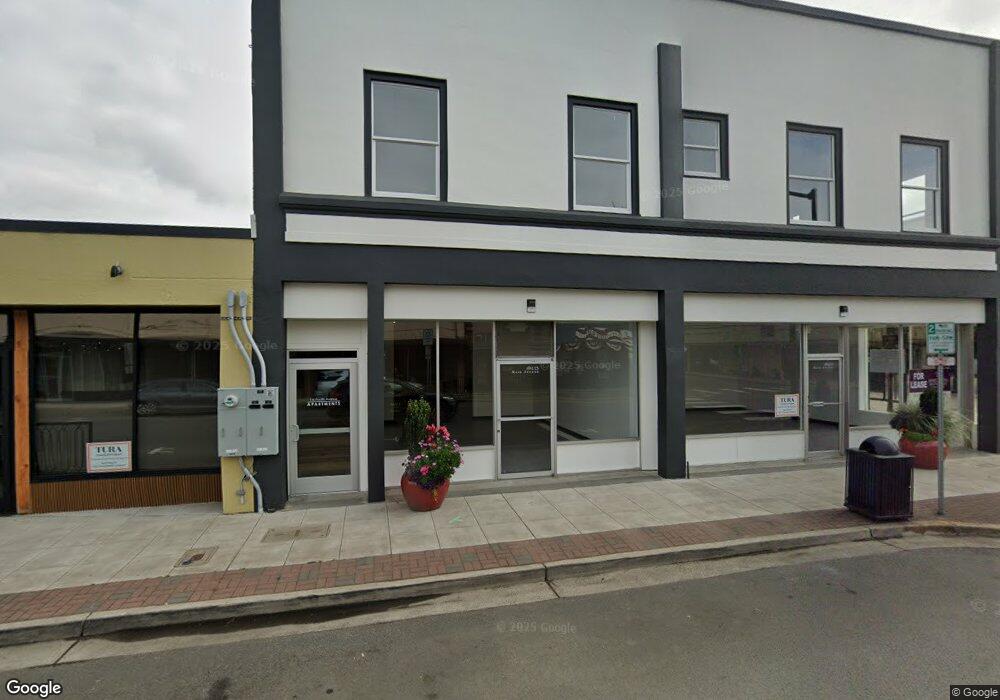
113 Main Ave Tillamook, OR 97141
Estimated Value: $498,443
Studio
--
Bath
13,900
Sq Ft
$36/Sq Ft
Est. Value
About This Home
This home is located at 113 Main Ave, Tillamook, OR 97141 and is currently priced at $498,443, approximately $35 per square foot. 113 Main Ave is a home located in Tillamook County with nearby schools including Tillamook High School, Tillamook Adventist School, and Pacific Christian School.
Ownership History
Date
Name
Owned For
Owner Type
Purchase Details
Closed on
Aug 25, 2021
Sold by
Albert Evers Lyle
Bought by
Phillips Terry L
Current Estimated Value
Home Financials for this Owner
Home Financials are based on the most recent Mortgage that was taken out on this home.
Original Mortgage
$322,500
Outstanding Balance
$193,738
Interest Rate
2.8%
Mortgage Type
New Conventional
Purchase Details
Closed on
May 8, 2007
Sold by
Long Joshua L and Long Stacy L
Bought by
Evers Lyle Albert and Evers Nayoko
Home Financials for this Owner
Home Financials are based on the most recent Mortgage that was taken out on this home.
Original Mortgage
$183,000
Interest Rate
6.14%
Mortgage Type
Commercial
Purchase Details
Closed on
Jul 29, 2005
Sold by
Long Joshua L and Bloomer Stephen
Bought by
Long Joshua L and Long Stacy L
Home Financials for this Owner
Home Financials are based on the most recent Mortgage that was taken out on this home.
Original Mortgage
$164,850
Interest Rate
5.56%
Mortgage Type
Stand Alone Refi Refinance Of Original Loan
Create a Home Valuation Report for This Property
The Home Valuation Report is an in-depth analysis detailing your home's value as well as a comparison with similar homes in the area
Home Values in the Area
Average Home Value in this Area
Purchase History
| Date | Buyer | Sale Price | Title Company |
|---|---|---|---|
| Phillips Terry L | $479,000 | Ticor Title | |
| Evers Lyle Albert | $263,000 | Fidelity Natl Title Co Of Or | |
| Long Joshua L | -- | Fidelity Natl Title Co Of Or |
Source: Public Records
Mortgage History
| Date | Status | Borrower | Loan Amount |
|---|---|---|---|
| Open | Phillips Terry L | $322,500 | |
| Previous Owner | Evers Lyle Albert | $183,000 | |
| Previous Owner | Long Joshua L | $164,850 |
Source: Public Records
Tax History
| Year | Tax Paid | Tax Assessment Tax Assessment Total Assessment is a certain percentage of the fair market value that is determined by local assessors to be the total taxable value of land and additions on the property. | Land | Improvement |
|---|---|---|---|---|
| 2025 | $4,962 | $407,470 | $189,570 | $217,900 |
| 2024 | $4,718 | $395,610 | $184,050 | $211,560 |
| 2023 | $4,675 | $384,090 | $178,690 | $205,400 |
| 2022 | $4,517 | $372,910 | $173,490 | $199,420 |
| 2021 | $4,385 | $362,050 | $168,440 | $193,610 |
| 2020 | $4,266 | $351,510 | $163,530 | $187,980 |
| 2019 | $4,159 | $341,280 | $158,770 | $182,510 |
| 2018 | $4,054 | $331,340 | $154,150 | $177,190 |
| 2017 | $3,953 | $321,690 | $149,660 | $172,030 |
| 2016 | $3,806 | $312,330 | $145,300 | $167,030 |
| 2015 | $3,451 | $280,040 | $103,630 | $176,410 |
| 2014 | $3,607 | $289,320 | $103,630 | $185,690 |
| 2013 | -- | $283,820 | $101,770 | $182,050 |
Source: Public Records
Map
Nearby Homes
- 1708 4th St
- 1706 5th St
- 2205 5th St
- 00201 Wilson River Hwy
- TL# 02100 Wilson River Hwy
- Parcel 1 Wilson River Hwy
- Parcel 2 Wilson River Hwy
- 2418 1st St
- 1806 8th St
- 2506 1st St
- 1403 5th St
- 116 Cedar Ave
- 2507 6th St
- 2213 10th St
- 1003 Grove Ave
- 409 Del Monte Ave
- 02600 12th St
- Lot 2405 12th St
- 702 Ash Ave
- 605 Cottonwood Ave
Your Personal Tour Guide
Ask me questions while you tour the home.