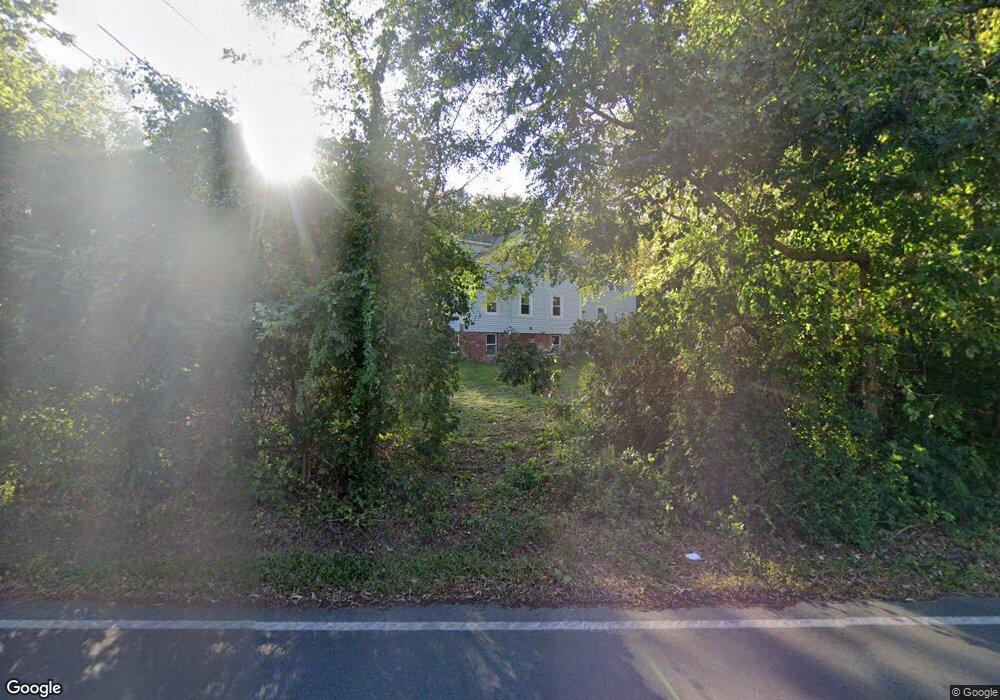
113 Main St Byfield, MA 01922
Estimated Value: $813,802 - $969,000
3
Beds
2
Baths
2,820
Sq Ft
$319/Sq Ft
Est. Value
About This Home
This home is located at 113 Main St, Byfield, MA 01922 and is currently estimated at $899,451, approximately $318 per square foot. 113 Main St is a home located in Essex County with nearby schools including Triton Regional High School and The Governors Academy.
Ownership History
Date
Name
Owned For
Owner Type
Purchase Details
Closed on
May 23, 2023
Sold by
Lojek Neal E and Lojek Patricia L
Bought by
Neal & Patricia Lojek Ret and Lojek
Current Estimated Value
Create a Home Valuation Report for This Property
The Home Valuation Report is an in-depth analysis detailing your home's value as well as a comparison with similar homes in the area
Home Values in the Area
Average Home Value in this Area
Purchase History
| Date | Buyer | Sale Price | Title Company |
|---|---|---|---|
| Neal & Patricia Lojek Ret | -- | None Available | |
| Neal & Patricia Lojek Ret | -- | None Available | |
| Neal & Patricia Lojek Ret | -- | None Available |
Source: Public Records
Tax History
| Year | Tax Paid | Tax Assessment Tax Assessment Total Assessment is a certain percentage of the fair market value that is determined by local assessors to be the total taxable value of land and additions on the property. | Land | Improvement |
|---|---|---|---|---|
| 2025 | $5,604 | $752,200 | $422,000 | $330,200 |
| 2024 | $5,332 | $694,300 | $377,400 | $316,900 |
| 2023 | $5,308 | $612,200 | $322,900 | $289,300 |
| 2022 | $5,281 | $542,800 | $290,200 | $252,600 |
| 2021 | $4,933 | $462,800 | $224,900 | $237,900 |
| 2020 | $5,006 | $455,500 | $224,900 | $230,600 |
| 2019 | $4,688 | $433,700 | $203,100 | $230,600 |
| 2018 | $4,527 | $415,300 | $203,100 | $212,200 |
| 2017 | $4,348 | $409,800 | $203,100 | $206,700 |
| 2016 | $3,897 | $341,800 | $159,600 | $182,200 |
| 2015 | $3,768 | $327,100 | $148,600 | $178,500 |
| 2014 | $3,703 | $327,100 | $148,600 | $178,500 |
Source: Public Records
Map
Nearby Homes
- 33 Downfall Rd
- 5 Oak Terrace
- 17 Church St
- 18 Forest St
- 55 Pearson Dr Unit 9 - ALDER
- 55 Pearson Dr Unit 8-Dogwood
- 55 Pearson Dr Unit 11-Chestnut
- 55 Pearson Dr Unit 3 - ALDER
- 55 Pearson Dr Unit 6-Dogwood
- 38 Pearson Dr
- 34 Central St
- 38 Main St
- 13 Main St
- 11 Main St
- 66 Parish Rd Unit 8
- 66 Parish Rd Unit 4
- 36 Caldwell Farm Rd
- 167 Middle St
- 126 Georgetown Rd
- 14 Sawmill Brook Rd
Your Personal Tour Guide
Ask me questions while you tour the home.