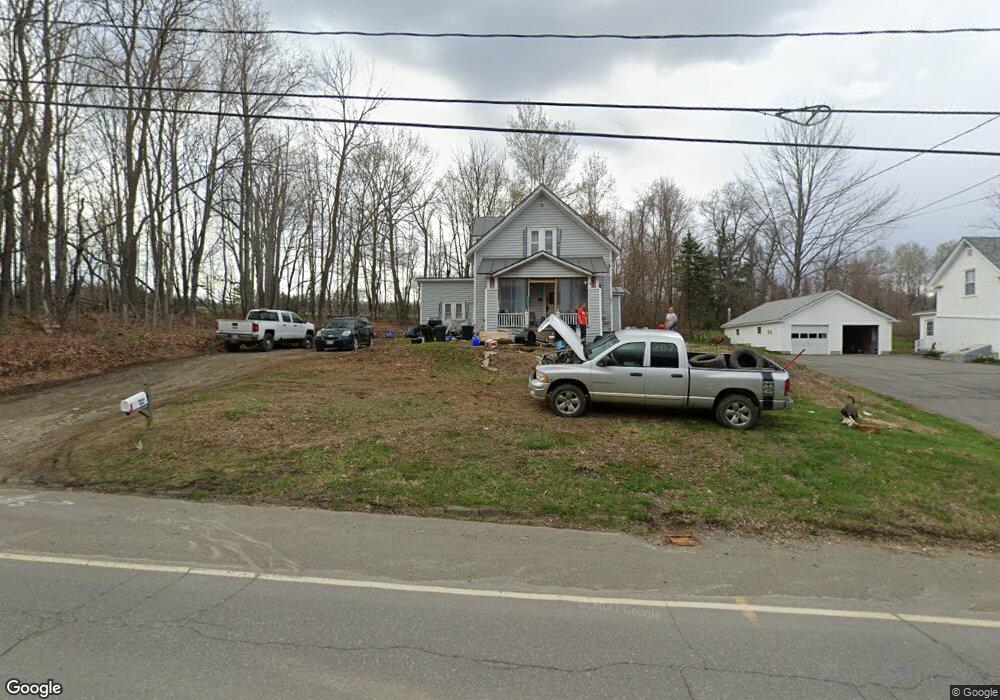
113 Main St Dexter, ME 04930
Estimated Value: $125,420 - $181,000
3
Beds
2
Baths
1,019
Sq Ft
$142/Sq Ft
Est. Value
About This Home
This home is located at 113 Main St, Dexter, ME 04930 and is currently estimated at $144,355, approximately $141 per square foot. 113 Main St is a home located in Penobscot County with nearby schools including Ridge View Community School, Dexter Regional High School, and Dexter Christian Academy.
Ownership History
Date
Name
Owned For
Owner Type
Purchase Details
Closed on
Dec 28, 2011
Sold by
Stewart Jonathan P and Stewart Tonya L
Bought by
Tarr Paul A and Tarr Kimberly A
Current Estimated Value
Home Financials for this Owner
Home Financials are based on the most recent Mortgage that was taken out on this home.
Original Mortgage
$68,127
Outstanding Balance
$45,846
Interest Rate
3.75%
Mortgage Type
FHA
Estimated Equity
$98,509
Purchase Details
Closed on
Sep 11, 2006
Sold by
Maine Housing Authority
Bought by
Stewart Jonathan P and Stewart Tonya L
Create a Home Valuation Report for This Property
The Home Valuation Report is an in-depth analysis detailing your home's value as well as a comparison with similar homes in the area
Home Values in the Area
Average Home Value in this Area
Purchase History
| Date | Buyer | Sale Price | Title Company |
|---|---|---|---|
| Tarr Paul A | -- | -- | |
| Stewart Jonathan P | -- | -- |
Source: Public Records
Mortgage History
| Date | Status | Borrower | Loan Amount |
|---|---|---|---|
| Open | Tarr Paul A | $68,127 |
Source: Public Records
Tax History Compared to Growth
Tax History
| Year | Tax Paid | Tax Assessment Tax Assessment Total Assessment is a certain percentage of the fair market value that is determined by local assessors to be the total taxable value of land and additions on the property. | Land | Improvement |
|---|---|---|---|---|
| 2024 | $1,280 | $65,300 | $12,100 | $53,200 |
| 2023 | $1,286 | $65,300 | $12,100 | $53,200 |
| 2022 | $1,284 | $64,200 | $11,000 | $53,200 |
| 2021 | $1,258 | $64,200 | $11,000 | $53,200 |
| 2020 | $1,258 | $64,200 | $11,000 | $53,200 |
| 2019 | $1,258 | $64,200 | $11,000 | $53,200 |
| 2018 | $1,258 | $64,200 | $11,000 | $53,200 |
| 2017 | $1,226 | $64,200 | $11,000 | $53,200 |
| 2016 | $1,194 | $64,200 | $11,000 | $53,200 |
| 2015 | $1,194 | $64,200 | $11,000 | $53,200 |
| 2014 | $1,136 | $64,200 | $11,000 | $53,200 |
Source: Public Records
Map
Nearby Homes