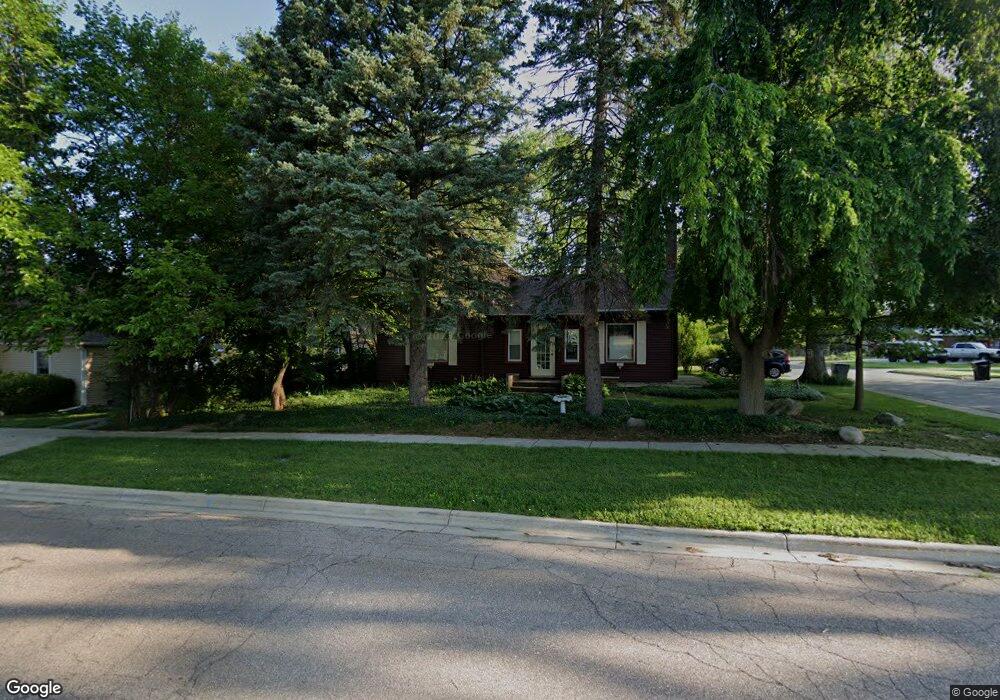
113 Maple St Three Oaks, MI 49128
Estimated Value: $363,000 - $453,000
3
Beds
3
Baths
1,800
Sq Ft
$218/Sq Ft
Est. Value
About This Home
This home is located at 113 Maple St, Three Oaks, MI 49128 and is currently estimated at $392,092, approximately $217 per square foot. 113 Maple St is a home located in Berrien County with nearby schools including River Valley Middle/High School.
Ownership History
Date
Name
Owned For
Owner Type
Purchase Details
Closed on
Aug 9, 2010
Sold by
Bulin Jeffrey and Bulin Nancy
Bought by
Ernst Edward C and Doyle Margaret M
Current Estimated Value
Home Financials for this Owner
Home Financials are based on the most recent Mortgage that was taken out on this home.
Original Mortgage
$152,000
Outstanding Balance
$100,943
Interest Rate
4.63%
Mortgage Type
New Conventional
Estimated Equity
$291,149
Purchase Details
Closed on
Nov 20, 2003
Sold by
Miller Ray C and Miller Melissa M
Bought by
Bank One Na
Purchase Details
Closed on
Jul 2, 1999
Purchase Details
Closed on
May 1, 1984
Purchase Details
Closed on
Oct 11, 1977
Create a Home Valuation Report for This Property
The Home Valuation Report is an in-depth analysis detailing your home's value as well as a comparison with similar homes in the area
Purchase History
| Date | Buyer | Sale Price | Title Company |
|---|---|---|---|
| Ernst Edward C | -- | Multiple | |
| Bank One Na | $84,638 | -- | |
| -- | $82,000 | -- | |
| -- | $34,000 | -- | |
| -- | $24,000 | -- |
Source: Public Records
Mortgage History
| Date | Status | Borrower | Loan Amount |
|---|---|---|---|
| Open | Ernst Edward C | $152,000 |
Source: Public Records
Tax History
| Year | Tax Paid | Tax Assessment Tax Assessment Total Assessment is a certain percentage of the fair market value that is determined by local assessors to be the total taxable value of land and additions on the property. | Land | Improvement |
|---|---|---|---|---|
| 2025 | $3,041 | $168,300 | $0 | $0 |
| 2024 | $1,856 | $153,200 | $0 | $0 |
| 2023 | $1,767 | $157,600 | $0 | $0 |
| 2022 | $1,698 | $124,900 | $0 | $0 |
| 2021 | $3,642 | $112,900 | $11,300 | $101,600 |
| 2020 | $3,469 | $87,100 | $0 | $0 |
| 2019 | $3,356 | $64,800 | $8,300 | $56,500 |
| 2018 | $5,583 | $64,800 | $0 | $0 |
| 2017 | $4,015 | $77,374 | $0 | $0 |
| 2016 | $3,952 | $75,910 | $0 | $0 |
| 2015 | $4,672 | $93,841 | $0 | $0 |
| 2014 | $965 | $89,323 | $0 | $0 |
Source: Public Records
Map
Nearby Homes
- 202 Maple St
- 103 Maple St
- 201 Sycamore St E
- 207 Cherry St
- 9 Beech St E
- 8 Poplar St
- 308 N Elm St
- 37 Huckleberry
- 202 S Elm St
- 614 Magnolia St
- 616 Magnolia St
- 5463 U S 12
- 7079 U S 12
- 7200 U S 12
- 7078 Us 12 Hwy W
- 18216 S Schwark Rd
- 0 W Elm Valley Rd Unit 25049923
- 17383 S Basswood Rd
- 6340 Warren Woods Rd
- 5563 Spring Creek Rd
Your Personal Tour Guide
Ask me questions while you tour the home.