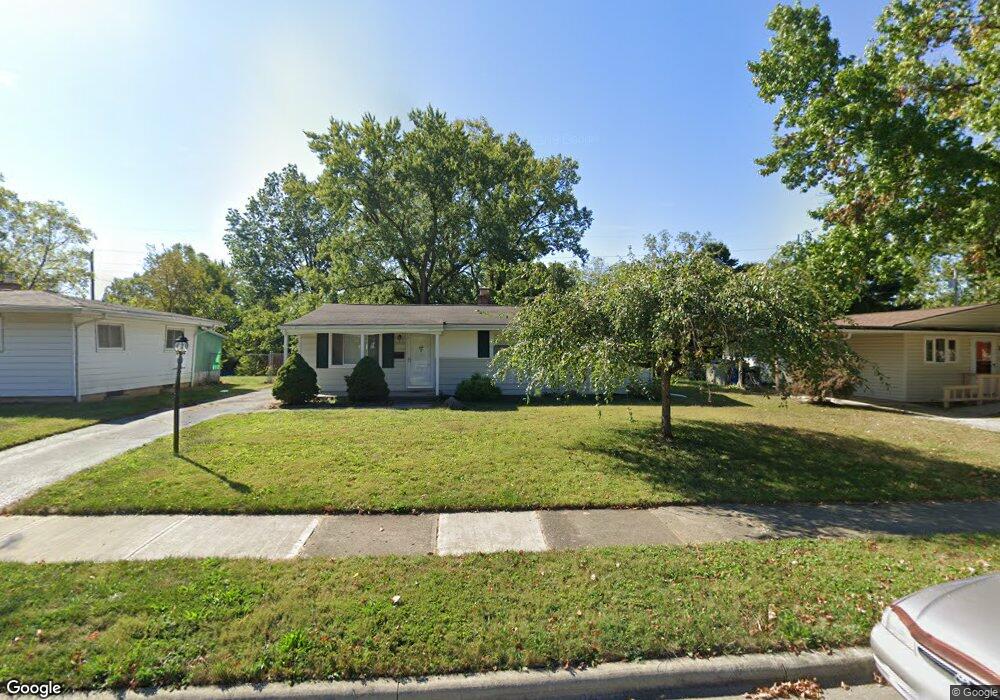
113 Mariemont Dr N Westerville, OH 43081
Estimated Value: $247,306 - $329,000
3
Beds
1
Bath
984
Sq Ft
$294/Sq Ft
Est. Value
About This Home
This home is located at 113 Mariemont Dr N, Westerville, OH 43081 and is currently estimated at $289,327, approximately $294 per square foot. 113 Mariemont Dr N is a home located in Franklin County with nearby schools including Whittier Elementary School, Blendon Middle School, and Westerville South High School.
Ownership History
Date
Name
Owned For
Owner Type
Purchase Details
Closed on
Jan 13, 2010
Sold by
Cook Gary and Cook Monica L
Bought by
George Christopher R
Current Estimated Value
Home Financials for this Owner
Home Financials are based on the most recent Mortgage that was taken out on this home.
Original Mortgage
$130,492
Outstanding Balance
$85,327
Interest Rate
4.87%
Mortgage Type
FHA
Estimated Equity
$204,000
Purchase Details
Closed on
Sep 26, 2007
Sold by
Hsbc Bank Usa
Bought by
Cook Gary and Cook Monica L
Home Financials for this Owner
Home Financials are based on the most recent Mortgage that was taken out on this home.
Original Mortgage
$96,300
Interest Rate
6.5%
Mortgage Type
Purchase Money Mortgage
Purchase Details
Closed on
Jun 6, 2007
Sold by
Lowe Keith A and Wells Fargo Home Mortgage Inc
Bought by
Hsbc Bank Usa and Citigroup Mortgage Loan Trust Inc Asset
Purchase Details
Closed on
Aug 1, 1986
Create a Home Valuation Report for This Property
The Home Valuation Report is an in-depth analysis detailing your home's value as well as a comparison with similar homes in the area
Home Values in the Area
Average Home Value in this Area
Purchase History
| Date | Buyer | Sale Price | Title Company |
|---|---|---|---|
| George Christopher R | $132,900 | Talon Group | |
| Cook Gary | $107,000 | Prism Title & Closing Servic | |
| Hsbc Bank Usa | $88,000 | None Available | |
| -- | $50,000 | -- |
Source: Public Records
Mortgage History
| Date | Status | Borrower | Loan Amount |
|---|---|---|---|
| Open | George Christopher R | $130,492 | |
| Previous Owner | Cook Gary | $96,300 |
Source: Public Records
Tax History Compared to Growth
Tax History
| Year | Tax Paid | Tax Assessment Tax Assessment Total Assessment is a certain percentage of the fair market value that is determined by local assessors to be the total taxable value of land and additions on the property. | Land | Improvement |
|---|---|---|---|---|
| 2024 | $3,714 | $65,350 | $16,240 | $49,110 |
| 2023 | $3,635 | $65,350 | $16,240 | $49,110 |
| 2022 | $3,861 | $53,000 | $20,830 | $32,170 |
| 2021 | $3,894 | $53,000 | $20,830 | $32,170 |
| 2020 | $3,883 | $53,000 | $20,830 | $32,170 |
| 2019 | $3,395 | $43,750 | $17,360 | $26,390 |
| 2018 | $3,457 | $43,750 | $17,360 | $26,390 |
| 2017 | $3,339 | $43,750 | $17,360 | $26,390 |
| 2016 | $3,690 | $39,770 | $13,270 | $26,500 |
| 2015 | $3,585 | $39,770 | $13,270 | $26,500 |
| 2014 | $3,232 | $39,770 | $13,270 | $26,500 |
| 2013 | $1,792 | $39,760 | $13,265 | $26,495 |
Source: Public Records
Map
Nearby Homes
- 502 Foxtrail Cir E Unit 502
- 206 Charring Cross Dr S Unit 2206
- 470 S State St
- 466 S State St
- 476 S State St
- 559 Allview Ct
- 465 W Schrock Rd
- 79 W Park St
- 25 King Arthur Blvd
- 66 Daleview Dr
- 53 W College Ave
- 360 Potawatomi Dr
- 0 Cherrington Rd Unit 225023909
- 199 E College Ave
- 0 Cooper Rd
- 417 E Park St
- 92 N Vine St
- 106 E Ticonderoga Dr
- 106 E Ticonderoga Dr Unit A
- 134 W Ticonderoga Dr Unit D
- 119 Mariemont Dr N
- 107 Mariemont Dr N
- 101 Mariemont Dr N
- 125 Mariemont Dr N
- 114 Mariemont Dr N
- 108 Mariemont Dr N
- 120 Mariemont Dr N
- 131 Mariemont Dr N
- 95 Mariemont Dr N
- 102 Mariemont Dr N
- 126 Mariemont Dr N
- 0 W Mariemont Dr N
- 399 Russell St
- 0 Mariemont Dr N
- 137 Mariemont Dr N
- 132 Mariemont Dr N
- 85 Mariemont Dr N
- 113 Parkview Ave
- 113 Parkview Ave
- 117 Parkview Ave