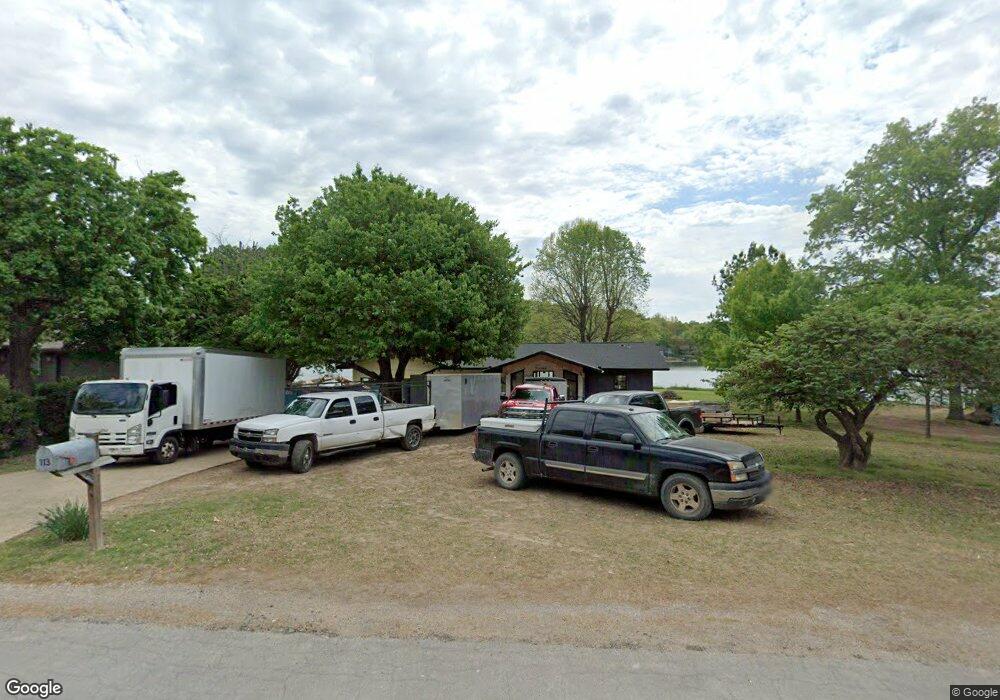
113 Mayfair Dr Bella Vista, AR 72715
Estimated Value: $474,000 - $763,000
3
Beds
2
Baths
2,370
Sq Ft
$279/Sq Ft
Est. Value
About This Home
This home is located at 113 Mayfair Dr, Bella Vista, AR 72715 and is currently estimated at $662,211, approximately $279 per square foot. 113 Mayfair Dr is a home located in Benton County with nearby schools including Cooper Elementary School, Old High Middle School, and Washington Junior High School.
Ownership History
Date
Name
Owned For
Owner Type
Purchase Details
Closed on
Sep 13, 2005
Sold by
Knudsen Edwin J and Knudsen Imogene L
Bought by
Carr Brent P and Carr Kim M
Current Estimated Value
Purchase Details
Closed on
Apr 23, 2001
Bought by
Knudsen Tr
Purchase Details
Closed on
Apr 17, 2001
Bought by
Knudsen Rev Trust
Purchase Details
Closed on
Nov 1, 1995
Bought by
Knudsen
Purchase Details
Closed on
Jul 4, 1995
Bought by
Dod 07-04-1995
Purchase Details
Closed on
Dec 16, 1992
Bought by
Dod 12-16-1992
Purchase Details
Closed on
Feb 24, 1989
Bought by
Stene Trust
Purchase Details
Closed on
Apr 16, 1985
Bought by
Stene Trust
Purchase Details
Closed on
Mar 31, 1983
Bought by
Stene
Create a Home Valuation Report for This Property
The Home Valuation Report is an in-depth analysis detailing your home's value as well as a comparison with similar homes in the area
Home Values in the Area
Average Home Value in this Area
Purchase History
| Date | Buyer | Sale Price | Title Company |
|---|---|---|---|
| Carr Brent P | $335,000 | Bronson Title Services Inc | |
| Knudsen Tr | -- | -- | |
| Knudsen Rev Trust | -- | -- | |
| Knudsen | $180,000 | -- | |
| Dod 07-04-1995 | -- | -- | |
| Dod 12-16-1992 | -- | -- | |
| Stene Trust | -- | -- | |
| Stene Trust | -- | -- | |
| Stene | $187,000 | -- |
Source: Public Records
Mortgage History
| Date | Status | Borrower | Loan Amount |
|---|---|---|---|
| Open | Stene | $130,000 |
Source: Public Records
Tax History Compared to Growth
Tax History
| Year | Tax Paid | Tax Assessment Tax Assessment Total Assessment is a certain percentage of the fair market value that is determined by local assessors to be the total taxable value of land and additions on the property. | Land | Improvement |
|---|---|---|---|---|
| 2025 | $6,094 | $174,688 | $30,000 | $144,688 |
| 2024 | $4,300 | $149,772 | $30,000 | $119,772 |
| 2023 | $4,095 | $77,110 | $15,200 | $61,910 |
| 2022 | $3,668 | $77,110 | $15,200 | $61,910 |
| 2021 | $3,476 | $77,110 | $15,200 | $61,910 |
| 2020 | $3,326 | $58,100 | $13,200 | $44,900 |
| 2019 | $3,326 | $58,100 | $13,200 | $44,900 |
| 2018 | $3,351 | $58,100 | $13,200 | $44,900 |
| 2017 | $3,212 | $58,100 | $13,200 | $44,900 |
| 2016 | $3,212 | $58,100 | $13,200 | $44,900 |
| 2015 | $3,508 | $58,170 | $10,800 | $47,370 |
| 2014 | $3,158 | $58,170 | $10,800 | $47,370 |
Source: Public Records
Map
Nearby Homes
- Lot 14 of Block 4 Heather Cir
- 55 Portsmouth Dr
- 18 Worstead Ln
- 4 Frensham Ln
- 22 Pembroke Ln
- Lot 26 Block 2 Kensington Dr
- 9 Connie Ln
- 6 Connie Ln
- 0 Portsmouth Dr Unit 1319021
- Lot 9 Clive Ln
- 6 Neffwood Ln
- 19 Brompton Dr
- 9 Estes Dr
- 13 Kensington Dr
- 21 Estes Dr
- Lot 5 Neffwood Ln
- 2 Wreston Ln
- 7 Joanie Ln
- 30 Cromer Dr
- TBD Dunsford Dr