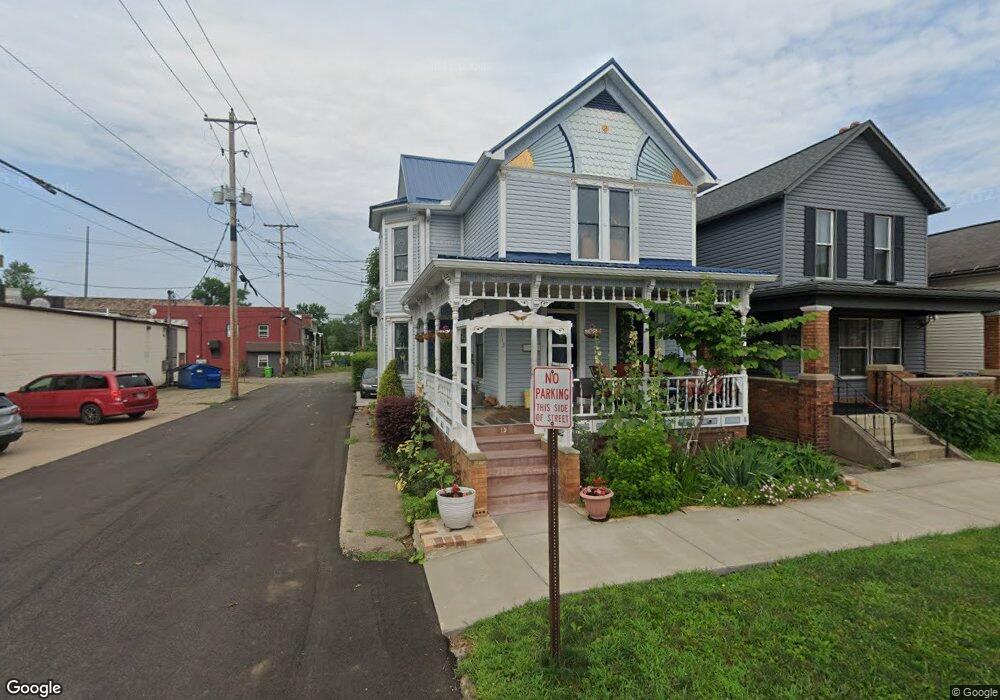
113 N 1st St Dennison, OH 44621
Estimated Value: $86,747 - $139,000
2
Beds
2
Baths
1,404
Sq Ft
$83/Sq Ft
Est. Value
About This Home
This home is located at 113 N 1st St, Dennison, OH 44621 and is currently estimated at $116,437, approximately $82 per square foot. 113 N 1st St is a home located in Tuscarawas County with nearby schools including Claymont High School and Immaculate Conception School.
Ownership History
Date
Name
Owned For
Owner Type
Purchase Details
Closed on
Dec 2, 2003
Sold by
Shalosky James M and Kister Kenneth
Bought by
Dowling Harry E and Dowling Janet E
Current Estimated Value
Home Financials for this Owner
Home Financials are based on the most recent Mortgage that was taken out on this home.
Original Mortgage
$49,410
Outstanding Balance
$23,247
Interest Rate
6.1%
Mortgage Type
Purchase Money Mortgage
Estimated Equity
$93,190
Purchase Details
Closed on
May 30, 2002
Sold by
Firstar Bank Trust
Bought by
Kister James M Shalosky Kenneth
Purchase Details
Closed on
Sep 11, 2001
Sold by
Shrf Thomas H Leidner Pr
Bought by
Firstar Bank
Purchase Details
Closed on
May 7, 1998
Sold by
Johnson Family Ltd Ptns
Bought by
Leidner Thomas H and Leidner Donna J
Home Financials for this Owner
Home Financials are based on the most recent Mortgage that was taken out on this home.
Original Mortgage
$16,100
Interest Rate
7.2%
Mortgage Type
New Conventional
Create a Home Valuation Report for This Property
The Home Valuation Report is an in-depth analysis detailing your home's value as well as a comparison with similar homes in the area
Home Values in the Area
Average Home Value in this Area
Purchase History
| Date | Buyer | Sale Price | Title Company |
|---|---|---|---|
| Dowling Harry E | $54,900 | Tusc Title | |
| Kister James M Shalosky Kenneth | $20,000 | -- | |
| Firstar Bank | $21,000 | -- | |
| Leidner Thomas H | $17,900 | -- |
Source: Public Records
Mortgage History
| Date | Status | Borrower | Loan Amount |
|---|---|---|---|
| Open | Dowling Harry E | $49,410 | |
| Previous Owner | Leidner Thomas H | $16,100 |
Source: Public Records
Tax History
| Year | Tax Paid | Tax Assessment Tax Assessment Total Assessment is a certain percentage of the fair market value that is determined by local assessors to be the total taxable value of land and additions on the property. | Land | Improvement |
|---|---|---|---|---|
| 2024 | $372 | $57,060 | $5,750 | $51,310 |
| 2023 | $372 | $57,060 | $5,750 | $51,310 |
| 2022 | $414 | $19,971 | $2,013 | $17,959 |
| 2021 | $320 | $16,790 | $1,526 | $15,264 |
| 2020 | $326 | $16,790 | $1,526 | $15,264 |
| 2019 | $312 | $16,790 | $1,526 | $15,264 |
| 2018 | $222 | $14,170 | $1,290 | $12,880 |
| 2017 | $235 | $14,170 | $1,290 | $12,880 |
| 2016 | $233 | $14,170 | $1,290 | $12,880 |
| 2014 | $211 | $13,600 | $1,230 | $12,370 |
| 2013 | $217 | $13,600 | $1,230 | $12,370 |
Source: Public Records
Map
Nearby Homes
- 11 Sherman St
- 318 Bank St
- 214 N Dawson St
- 530 E High St
- 129 S Main St
- 213 Fuhr St
- 911 N Water St
- 618 Parrish St
- 118 Woodland Ave
- 507 W 3rd St
- 527 W 3rd St
- 315 Orchard St
- 119 S Wallace St
- 621 Newport Ave
- 228 Gardner Ave
- 222 Mccarty Ave
- 4848 Fette Rd SE
- 335 Packer St
- 0 Wright Dr SE
- 6781 Superior Rd SE
Your Personal Tour Guide
Ask me questions while you tour the home.