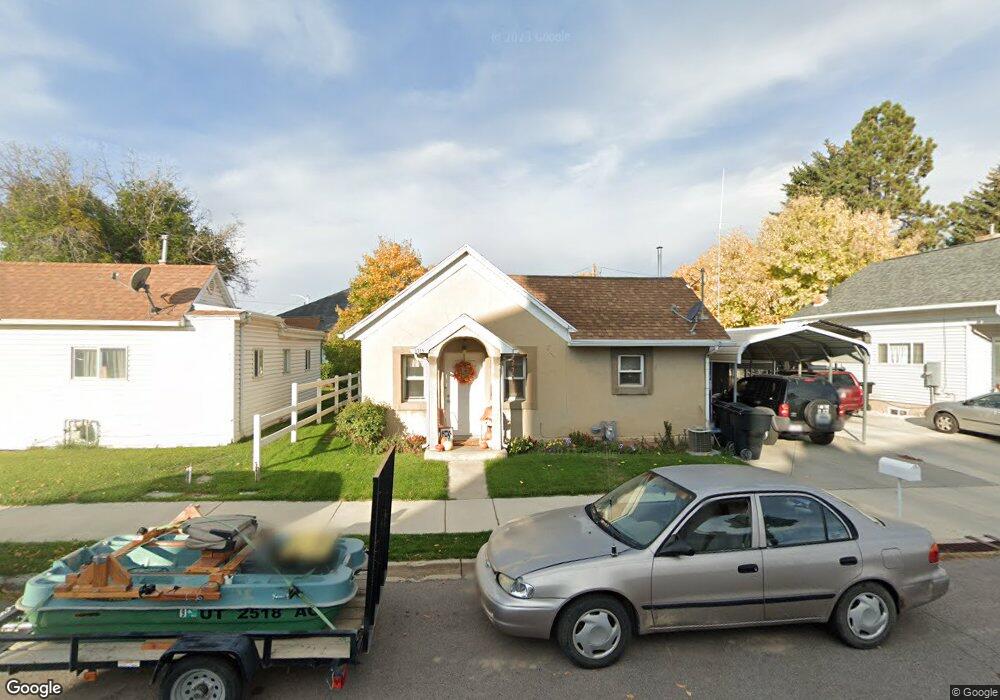
113 N 300 E Payson, UT 84651
Estimated Value: $412,000 - $510,000
4
Beds
2
Baths
1,510
Sq Ft
$314/Sq Ft
Est. Value
About This Home
This home is located at 113 N 300 E, Payson, UT 84651 and is currently estimated at $473,824, approximately $313 per square foot. 113 N 300 E is a home located in Utah County with nearby schools including Barnett Elementary School, Salem Junior High School, and Valley View Middle School.
Ownership History
Date
Name
Owned For
Owner Type
Purchase Details
Closed on
Dec 30, 2025
Sold by
Barnes Russell
Bought by
Reynoso Luis F
Current Estimated Value
Home Financials for this Owner
Home Financials are based on the most recent Mortgage that was taken out on this home.
Original Mortgage
$367,500
Outstanding Balance
$367,150
Interest Rate
6.23%
Mortgage Type
New Conventional
Estimated Equity
$106,674
Purchase Details
Closed on
Feb 15, 2023
Sold by
Foster Guy N
Bought by
Barnes Russell
Home Financials for this Owner
Home Financials are based on the most recent Mortgage that was taken out on this home.
Original Mortgage
$337,500
Interest Rate
6.48%
Mortgage Type
New Conventional
Purchase Details
Closed on
Feb 12, 2021
Sold by
Peery Lynn Allen and Peery Verl Dene
Bought by
Peery Lynn Allen and Fam Verl
Home Financials for this Owner
Home Financials are based on the most recent Mortgage that was taken out on this home.
Original Mortgage
$271,875
Interest Rate
2.6%
Mortgage Type
New Conventional
Purchase Details
Closed on
Feb 11, 2021
Sold by
Peery Hal J and Lynn Allen Peery
Bought by
Foster Guy N
Home Financials for this Owner
Home Financials are based on the most recent Mortgage that was taken out on this home.
Original Mortgage
$271,875
Interest Rate
2.6%
Mortgage Type
New Conventional
Create a Home Valuation Report for This Property
The Home Valuation Report is an in-depth analysis detailing your home's value as well as a comparison with similar homes in the area
Home Values in the Area
Average Home Value in this Area
Purchase History
| Date | Buyer | Sale Price | Title Company |
|---|---|---|---|
| Reynoso Luis F | -- | Ohana Title | |
| Barnes Russell | -- | Masters Title | |
| Peery Lynn Allen | -- | -- | |
| Foster Guy N | -- | Inwest Title Services |
Source: Public Records
Mortgage History
| Date | Status | Borrower | Loan Amount |
|---|---|---|---|
| Open | Reynoso Luis F | $367,500 | |
| Previous Owner | Barnes Russell | $337,500 | |
| Previous Owner | Foster Guy N | $271,875 |
Source: Public Records
Tax History
| Year | Tax Paid | Tax Assessment Tax Assessment Total Assessment is a certain percentage of the fair market value that is determined by local assessors to be the total taxable value of land and additions on the property. | Land | Improvement |
|---|---|---|---|---|
| 2025 | $1,567 | $178,255 | -- | -- |
| 2024 | $1,567 | $159,500 | $0 | $0 |
| 2023 | $1,565 | $159,720 | $0 | $0 |
| 2022 | $1,632 | $163,845 | $0 | $0 |
| 2021 | $1,382 | $222,500 | $86,400 | $136,100 |
| 2020 | $1,341 | $211,200 | $75,100 | $136,100 |
| 2019 | $875 | $141,300 | $63,400 | $77,900 |
| 2018 | $908 | $141,300 | $63,400 | $77,900 |
| 2017 | $1,076 | $90,035 | $0 | $0 |
| 2016 | $978 | $81,290 | $0 | $0 |
| 2015 | $984 | $81,290 | $0 | $0 |
| 2014 | $954 | $79,365 | $0 | $0 |
Source: Public Records
Map
Nearby Homes
Your Personal Tour Guide
Ask me questions while you tour the home.