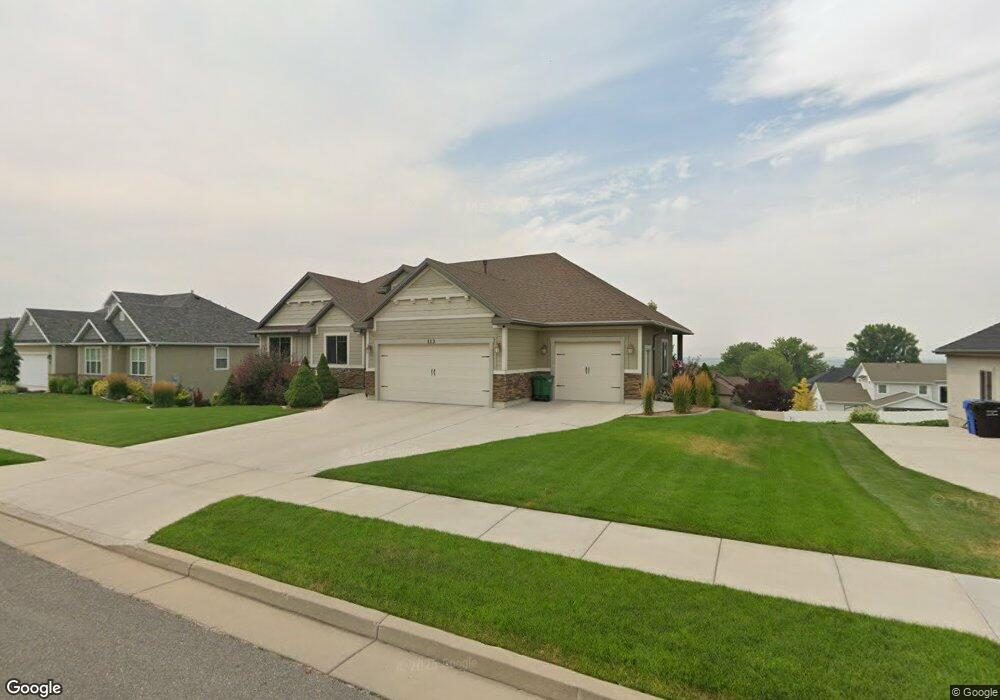
113 N 820 E Hyde Park, UT 84318
Estimated Value: $708,115 - $826,000
5
Beds
3
Baths
3,908
Sq Ft
$195/Sq Ft
Est. Value
About This Home
This home is located at 113 N 820 E, Hyde Park, UT 84318 and is currently estimated at $761,279, approximately $194 per square foot. 113 N 820 E is a home located in Cache County with nearby schools including North Park School, Cedar Ridge School, and North Cache Middle School.
Ownership History
Date
Name
Owned For
Owner Type
Purchase Details
Closed on
Jun 10, 2020
Sold by
Young Arthur S and Young Melissa A
Bought by
Bowman James S and Bowman Juanita B
Current Estimated Value
Home Financials for this Owner
Home Financials are based on the most recent Mortgage that was taken out on this home.
Original Mortgage
$250,000
Outstanding Balance
$221,116
Interest Rate
3.2%
Mortgage Type
New Conventional
Estimated Equity
$540,163
Purchase Details
Closed on
Aug 1, 2017
Sold by
Mcdonald Dale and Mcdonald Shannon
Bought by
Young Arthur S and Young Melissa A
Home Financials for this Owner
Home Financials are based on the most recent Mortgage that was taken out on this home.
Original Mortgage
$335,900
Interest Rate
3.96%
Mortgage Type
New Conventional
Purchase Details
Closed on
Oct 7, 2011
Sold by
Foothills Construction & Development Inc
Bought by
Mcdonald Dale and Mcdonald Shannon
Create a Home Valuation Report for This Property
The Home Valuation Report is an in-depth analysis detailing your home's value as well as a comparison with similar homes in the area
Home Values in the Area
Average Home Value in this Area
Purchase History
| Date | Buyer | Sale Price | Title Company |
|---|---|---|---|
| Bowman James S | -- | Cache Title Logan | |
| Young Arthur S | -- | None Available | |
| Mcdonald Dale | -- | Pinnacle Title Ins Agency |
Source: Public Records
Mortgage History
| Date | Status | Borrower | Loan Amount |
|---|---|---|---|
| Open | Bowman James S | $250,000 | |
| Previous Owner | Young Arthur S | $335,900 |
Source: Public Records
Tax History
| Year | Tax Paid | Tax Assessment Tax Assessment Total Assessment is a certain percentage of the fair market value that is determined by local assessors to be the total taxable value of land and additions on the property. | Land | Improvement |
|---|---|---|---|---|
| 2025 | $2,829 | $390,000 | $0 | $0 |
| 2024 | $3,440 | $437,265 | $0 | $0 |
| 2023 | $3,581 | $433,070 | $0 | $0 |
| 2022 | $372 | $433,070 | $0 | $0 |
| 2021 | $2,881 | $526,272 | $105,000 | $421,272 |
| 2020 | $2,714 | $471,324 | $105,000 | $366,324 |
| 2019 | $2,859 | $471,324 | $105,000 | $366,324 |
| 2018 | $2,426 | $392,075 | $65,000 | $327,075 |
| 2017 | $2,434 | $207,075 | $0 | $0 |
| 2016 | $2,469 | $198,550 | $0 | $0 |
| 2015 | $2,342 | $198,550 | $0 | $0 |
| 2014 | $2,282 | $198,550 | $0 | $0 |
| 2013 | -- | $60,000 | $0 | $0 |
Source: Public Records
Map
Nearby Homes
- 116 N 820 E
- 1087 E 160 N
- 458 W Madison St S
- 1130 E 245 N
- 201 N 1000 E Unit 19
- 1109 E 245 N
- 830 E 410 N Unit 161
- 635 S 125 E Unit 120
- 454 W Madison St S
- 1070 E 200 N Unit 24
- 480 N 729 E
- 640 S 175 E
- 150 E 650 S Unit 108
- 626 S 125 E
- 613 S 175 E
- 623 S 125 E
- 803 E 160 N Unit 1
- 882 E 160 N Unit 4
- 108 N 900 E
- 898 E 260 N
Your Personal Tour Guide
Ask me questions while you tour the home.