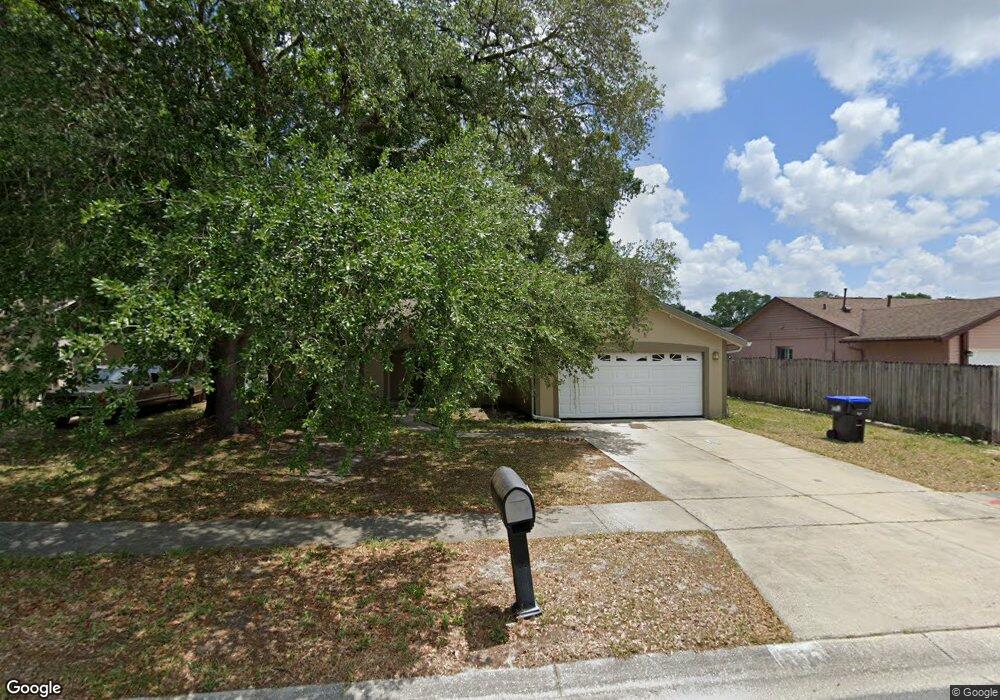
113 N Apollo Dr Unit 1 Apopka, FL 32703
Estimated Value: $293,000 - $344,000
3
Beds
2
Baths
1,794
Sq Ft
$175/Sq Ft
Est. Value
About This Home
This home is located at 113 N Apollo Dr Unit 1, Apopka, FL 32703 and is currently estimated at $314,490, approximately $175 per square foot. 113 N Apollo Dr Unit 1 is a home located in Orange County with nearby schools including Clay Springs Elementary School, Piedmont Lakes Middle School, and Wekiva High School.
Ownership History
Date
Name
Owned For
Owner Type
Purchase Details
Closed on
Feb 17, 2023
Sold by
Hung Christopher L and Hung Lucy
Bought by
Hung Christopher L and Mandala Luciana Wadya
Current Estimated Value
Purchase Details
Closed on
Jun 16, 2011
Sold by
Vanderbilt Mortgage & Finance Inc
Bought by
Hung Christopher L and Wadyamandala Lucy
Home Financials for this Owner
Home Financials are based on the most recent Mortgage that was taken out on this home.
Original Mortgage
$40,000
Interest Rate
4.65%
Mortgage Type
Balloon
Purchase Details
Closed on
May 17, 2008
Sold by
Cantu Gerardo A and Cantu Raul A
Bought by
Cantu Raul A and Mireles Bertha A
Purchase Details
Closed on
Jan 23, 2006
Sold by
Pimentel Celestino and Cantu Gerardo
Bought by
Cantu Raul A and Cantu Gerardo
Purchase Details
Closed on
Apr 25, 1996
Sold by
Bocanegra David A
Bought by
Cantu Gerardo A and Pimentel Celestino
Home Financials for this Owner
Home Financials are based on the most recent Mortgage that was taken out on this home.
Original Mortgage
$4,300
Interest Rate
7.8%
Create a Home Valuation Report for This Property
The Home Valuation Report is an in-depth analysis detailing your home's value as well as a comparison with similar homes in the area
Home Values in the Area
Average Home Value in this Area
Purchase History
| Date | Buyer | Sale Price | Title Company |
|---|---|---|---|
| Hung Christopher L | -- | None Listed On Document | |
| Hung Christopher L | $57,000 | All American Land Title | |
| Cantu Raul A | $94,500 | None Available | |
| Cantu Raul A | $24,000 | None Available | |
| Cantu Gerardo A | $31,600 | -- |
Source: Public Records
Mortgage History
| Date | Status | Borrower | Loan Amount |
|---|---|---|---|
| Previous Owner | Hung Christopher L | $40,000 | |
| Previous Owner | Cantu Gerardo A | $4,300 |
Source: Public Records
Tax History Compared to Growth
Tax History
| Year | Tax Paid | Tax Assessment Tax Assessment Total Assessment is a certain percentage of the fair market value that is determined by local assessors to be the total taxable value of land and additions on the property. | Land | Improvement |
|---|---|---|---|---|
| 2025 | $3,790 | $189,132 | -- | -- |
| 2024 | $3,343 | $189,132 | -- | -- |
| 2023 | $3,343 | $237,053 | $75,000 | $162,053 |
| 2022 | $3,024 | $211,273 | $75,000 | $136,273 |
| 2021 | $2,710 | $174,568 | $55,000 | $119,568 |
| 2020 | $2,463 | $166,495 | $46,000 | $120,495 |
| 2019 | $2,425 | $156,423 | $35,000 | $121,423 |
| 2018 | $2,132 | $124,871 | $25,000 | $99,871 |
| 2017 | $2,041 | $122,305 | $25,000 | $97,305 |
| 2016 | $1,830 | $101,838 | $15,000 | $86,838 |
| 2015 | $1,652 | $83,152 | $10,000 | $73,152 |
| 2014 | $1,502 | $66,289 | $10,000 | $56,289 |
Source: Public Records
Map
Nearby Homes
- 111 N Atlas Dr
- 14 Cyclops Dr
- 17 S Aurora Dr
- 2031 Wekiva Reserve Blvd
- 2217 Wekiva Reserve Blvd
- 2242 Wekiva Reserve Blvd
- 215 Bronze Leaf Ct
- 1816 Pegasus Dr
- 1801 Bent Oak Ct
- 1661 Votaw Rd
- 2343 Walnut Heights Rd
- 2421 Cimmaron Ash Way
- 2519 Walnut Heights Rd
- 473 Burnt Tree Ln
- 1951 Lost Pine Ln
- 2434 Walnut Heights Rd
- 1532 E Semoran Blvd
- 506 N Lake Pleasant Rd
- 2474 Cimmaron Ash Way
- 2486 Cimmaron Ash Way
- 105 N Apollo Dr
- 112 N Atlas Dr
- 120 N Atlas Dr
- 104 N Atlas Dr Unit 1
- 114 N Apollo Dr
- 129 N Apollo Dr
- 106 N Apollo Dr
- 106 N Apollo Dr Unit 1
- 128 N Atlas Dr
- 121 N Apollo Dr
- 1910 Haperon St
- 137 N Apollo Dr
- 1916 Haperon St
- 136 N Atlas Dr
- 1904 Haperon St
- 130 N Apollo Dr
- 1827 Bonerly Cir
- 119 N Atlas Dr
- 119 N Atlas Dr Unit 1