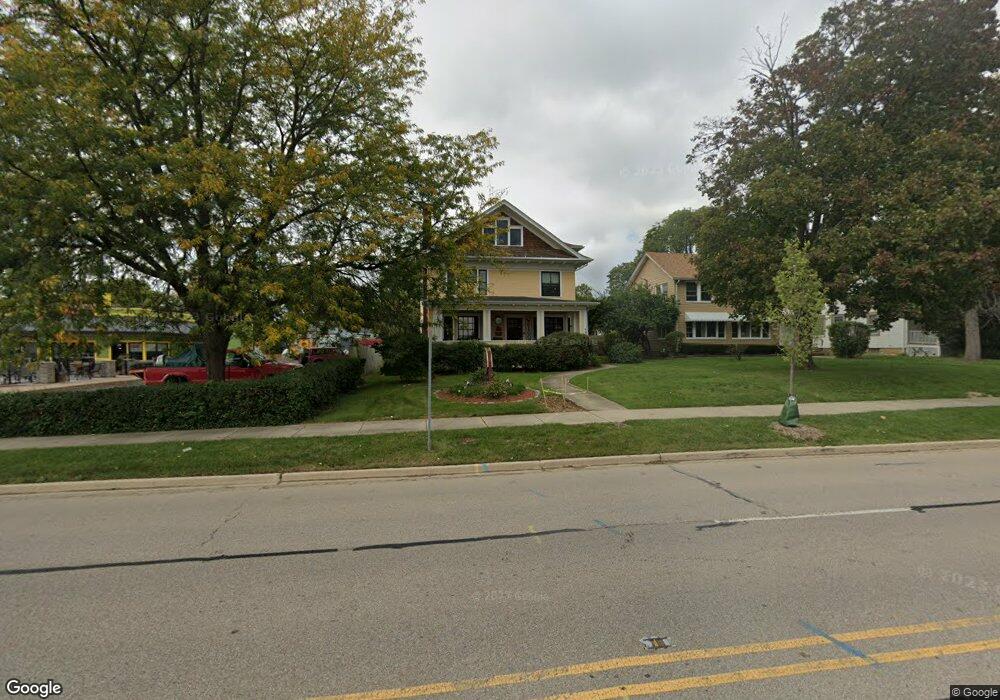
113 N Batavia Ave Batavia, IL 60510
Northwest Batavia Neighborhood
4
Beds
3
Baths
2,514
Sq Ft
--
Built
About This Home
This home is located at 113 N Batavia Ave, Batavia, IL 60510. 113 N Batavia Ave is a home located in Kane County with nearby schools including H C Storm Elementary School, Sam Rotolo Middle School, and Batavia Sr High School.
Ownership History
Date
Name
Owned For
Owner Type
Purchase Details
Closed on
Oct 28, 2011
Sold by
Ducoff Paul and Ducoff Karen
Bought by
Chicago Title Land Trust Company and Trust #8002358183
Purchase Details
Closed on
Aug 16, 2010
Sold by
Lunn Timothy
Bought by
Chase Home Finance Llc
Purchase Details
Closed on
Nov 3, 2003
Sold by
Redbud Properties Inc
Bought by
Lunn Timothy
Home Financials for this Owner
Home Financials are based on the most recent Mortgage that was taken out on this home.
Original Mortgage
$260,000
Interest Rate
6.01%
Mortgage Type
Commercial
Purchase Details
Closed on
May 3, 2001
Sold by
Perrone Ethel I
Bought by
Redbud Properties Inc
Home Financials for this Owner
Home Financials are based on the most recent Mortgage that was taken out on this home.
Original Mortgage
$220,000
Interest Rate
8%
Mortgage Type
Commercial
Create a Home Valuation Report for This Property
The Home Valuation Report is an in-depth analysis detailing your home's value as well as a comparison with similar homes in the area
Home Values in the Area
Average Home Value in this Area
Purchase History
| Date | Buyer | Sale Price | Title Company |
|---|---|---|---|
| Chicago Title Land Trust Company | -- | Chicago Title Insurance Co | |
| Ducoff Paul | $184,000 | None Available | |
| Chase Home Finance Llc | -- | None Available | |
| Lunn Timothy | -- | First American Title Ins Co | |
| Redbud Properties Inc | $275,000 | Chicago Title Insurance Co |
Source: Public Records
Mortgage History
| Date | Status | Borrower | Loan Amount |
|---|---|---|---|
| Previous Owner | Lunn Timothy | $260,000 | |
| Previous Owner | Redbud Properties Inc | $220,000 |
Source: Public Records
Tax History Compared to Growth
Tax History
| Year | Tax Paid | Tax Assessment Tax Assessment Total Assessment is a certain percentage of the fair market value that is determined by local assessors to be the total taxable value of land and additions on the property. | Land | Improvement |
|---|---|---|---|---|
| 2024 | $9,724 | $120,065 | $52,322 | $67,743 |
| 2023 | $9,564 | $108,972 | $47,488 | $61,484 |
| 2022 | $9,090 | $101,843 | $44,381 | $57,462 |
| 2021 | $8,766 | $96,588 | $42,091 | $54,497 |
| 2020 | $8,568 | $94,731 | $41,282 | $53,449 |
| 2019 | $8,439 | $91,378 | $39,821 | $51,557 |
| 2018 | $8,121 | $87,897 | $38,304 | $49,593 |
| 2017 | $8,423 | $90,328 | $37,041 | $53,287 |
| 2016 | $8,270 | $87,697 | $35,962 | $51,735 |
| 2015 | -- | $85,700 | $35,143 | $50,557 |
| 2014 | -- | $83,003 | $34,037 | $48,966 |
| 2013 | -- | $81,384 | $33,373 | $48,011 |
Source: Public Records
Map
Nearby Homes
- 21 N Lincoln St
- 123 N Jefferson St
- 330 First St
- 345 Main St
- 514 Main St
- 605 Main St
- 221 Elm St
- 107 N Mallory Ave
- 950 Houston St
- 982 Houston St
- 1062 Houston St Unit 74004
- 1054 Houston St Unit 89004
- 1058 Houston St Unit 74003
- 918 Houston St
- 942 Houston St
- 1075 Houston St Unit 89002
- 934 Houston St
- 910 Houston St
- 966 Houston St
- 109 N Van Nortwick Ave
- 119 N Batavia Ave Unit 121
- 121 N Batavia Ave
- 123 N Batavia Ave
- 327 Houston St
- 133 N Batavia Ave
- 316 Mckee St
- 322 Mckee St
- 335 Houston St
- 118 N Batavia Ave
- 108 N Batavia Ave
- 338 Mckee St Unit B
- 124 N Batavia Ave
- 336 Mckee St Unit D
- 336 Mckee St Unit MB
- 336 Mckee St Unit W
- 336 Mckee St Unit S
- 336 Mckee St Unit B
- 336 Mckee St Unit MA
- 336 Mckee St Unit U
- 130 N Batavia Ave