113 N Cedar Ln Upper Darby, PA 19082
Estimated Value: $197,000 - $231,000
3
Beds
1
Bath
1,290
Sq Ft
$165/Sq Ft
Est. Value
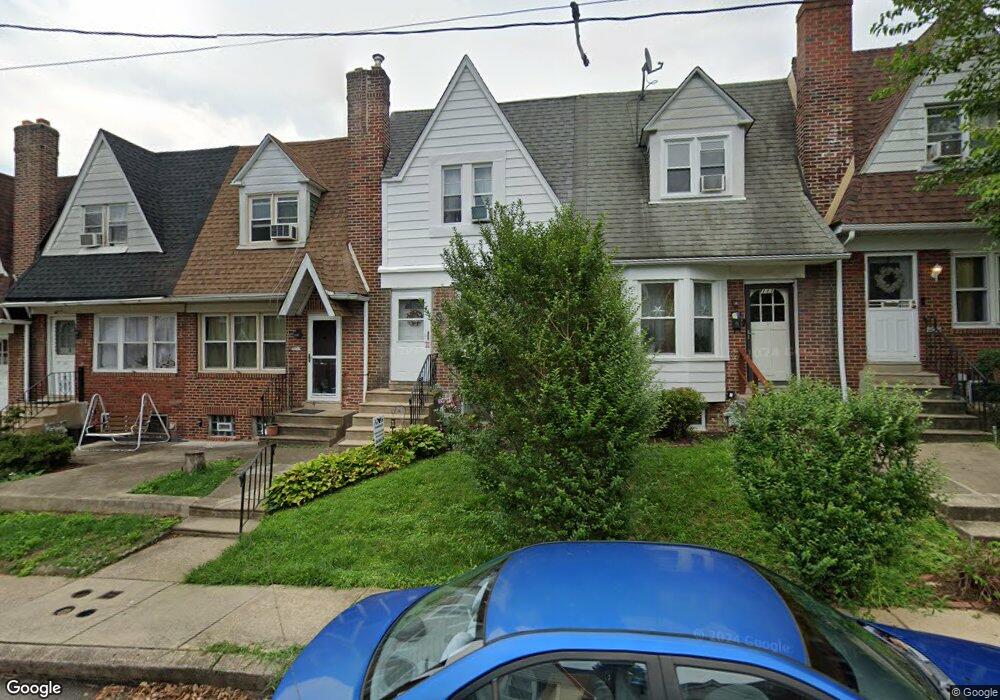
About This Home
This home is located at 113 N Cedar Ln, Upper Darby, PA 19082 and is currently estimated at $213,088, approximately $165 per square foot. 113 N Cedar Ln is a home located in Delaware County with nearby schools including Upper Darby Kdg Center, Drexel Hill Middle School, and Upper Darby High School.
Ownership History
Date
Name
Owned For
Owner Type
Purchase Details
Closed on
Jul 8, 2011
Sold by
Lohr Lauren M
Bought by
Lohr Joseph J and Lohr Lauren M
Current Estimated Value
Home Financials for this Owner
Home Financials are based on the most recent Mortgage that was taken out on this home.
Original Mortgage
$84,000
Interest Rate
4.49%
Mortgage Type
New Conventional
Purchase Details
Closed on
Mar 11, 2005
Sold by
Lusch Lauren M
Bought by
Lohr Lauren M
Home Financials for this Owner
Home Financials are based on the most recent Mortgage that was taken out on this home.
Original Mortgage
$60,000
Interest Rate
5.61%
Mortgage Type
Stand Alone Refi Refinance Of Original Loan
Purchase Details
Closed on
Sep 15, 1997
Sold by
Lohr John M and Lohr Sandra Marie
Bought by
Lusch Lauren M
Home Financials for this Owner
Home Financials are based on the most recent Mortgage that was taken out on this home.
Original Mortgage
$41,769
Interest Rate
7.23%
Mortgage Type
FHA
Create a Home Valuation Report for This Property
The Home Valuation Report is an in-depth analysis detailing your home's value as well as a comparison with similar homes in the area
Home Values in the Area
Average Home Value in this Area
Purchase History
| Date | Buyer | Sale Price | Title Company |
|---|---|---|---|
| Lohr Joseph J | -- | None Available | |
| Lohr Lauren M | -- | -- | |
| Lusch Lauren M | $41,500 | -- |
Source: Public Records
Mortgage History
| Date | Status | Borrower | Loan Amount |
|---|---|---|---|
| Closed | Lohr Joseph J | $84,000 | |
| Closed | Lohr Lauren M | $60,000 | |
| Previous Owner | Lusch Lauren M | $41,769 |
Source: Public Records
Tax History Compared to Growth
Tax History
| Year | Tax Paid | Tax Assessment Tax Assessment Total Assessment is a certain percentage of the fair market value that is determined by local assessors to be the total taxable value of land and additions on the property. | Land | Improvement |
|---|---|---|---|---|
| 2025 | $3,698 | $87,450 | $23,340 | $64,110 |
| 2024 | $3,698 | $87,450 | $23,340 | $64,110 |
| 2023 | $3,664 | $87,450 | $23,340 | $64,110 |
| 2022 | $3,565 | $87,450 | $23,340 | $64,110 |
| 2021 | $4,807 | $87,450 | $23,340 | $64,110 |
| 2020 | $3,794 | $58,660 | $23,340 | $35,320 |
| 2019 | $3,728 | $58,660 | $23,340 | $35,320 |
| 2018 | $3,685 | $58,660 | $0 | $0 |
| 2017 | $3,589 | $58,660 | $0 | $0 |
| 2016 | $322 | $58,660 | $0 | $0 |
| 2015 | $322 | $58,660 | $0 | $0 |
| 2014 | $322 | $58,660 | $0 | $0 |
Source: Public Records
Map
Nearby Homes
- 113 Saint Laurence Rd
- 105 Academy Ln
- 8125 W Chester Pike Unit C5
- 131 Westdale Rd
- 105 N Fairview Ave
- 7755 Parkview Rd
- 20 S Carol Blvd
- 103 Oakley Rd
- 214 N Lynn Blvd
- 46 S State Rd
- 9 Ardsley Rd
- 9 Ardsley Rd Unit 90
- 235 N Linden Ave
- 7419 W Chester Pike
- 221 N Linden Ave
- 7212 Wayne Ave
- 217 Windsor Ave
- 7926 Westview Ave
- 24 Sunshine Rd
- 7209 Hilltop Rd
- 111 N Cedar Ln
- 115 N Cedar Ln
- 109 N Cedar Ln
- 117 N Cedar Ln
- 107 N Cedar Ln
- 119 N Cedar Ln
- 121 N Cedar Ln
- 105 N Cedar Ln
- 123 N Cedar Ln
- 125 N Cedar Ln
- 114 N Madison Ave
- 116 N Madison Ave
- 112 N Madison Ave
- 118 N Madison Ave
- 110 N Madison Ave
- 108 N Madison Ave
- 120 N Madison Ave
- 127 N Cedar Ln
- 122 N Madison Ave
- 124 N Madison Ave