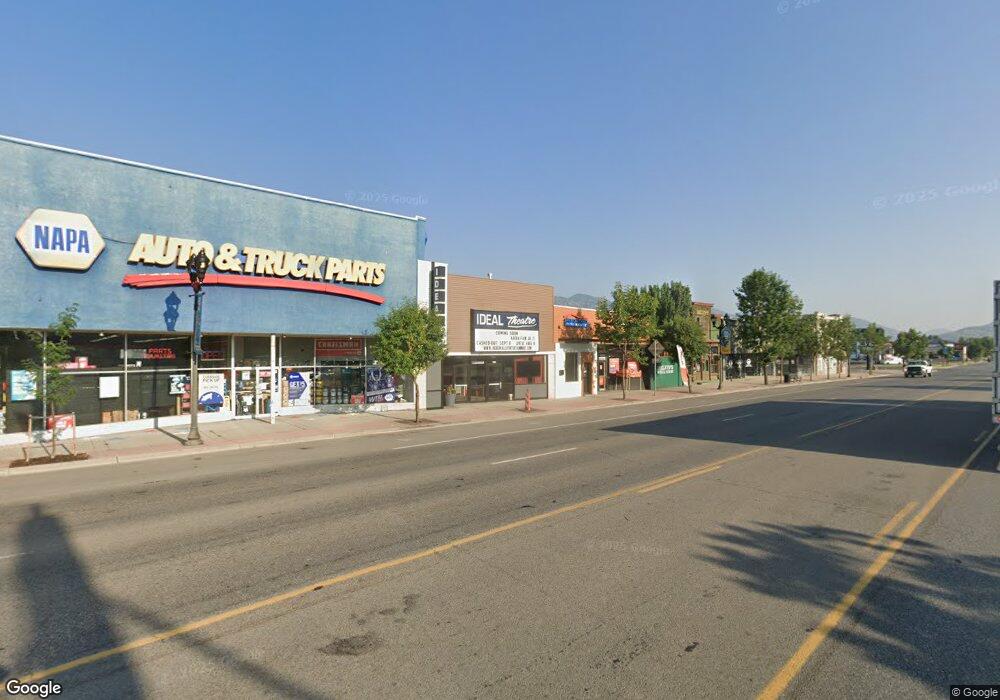
113 N Main St Heber City, UT 84032
Estimated Value: $903,000 - $965,378
--
Bed
--
Bath
3,866
Sq Ft
$241/Sq Ft
Est. Value
About This Home
This home is located at 113 N Main St, Heber City, UT 84032 and is currently estimated at $931,595, approximately $240 per square foot. 113 N Main St is a home located in Wasatch County with nearby schools including Heber Valley Elementary School, Rocky Mountain Middle School, and Wasatch High School.
Ownership History
Date
Name
Owned For
Owner Type
Purchase Details
Closed on
Jul 20, 2023
Sold by
Heber City Theatre Llc
Bought by
113 N Main Llc
Current Estimated Value
Home Financials for this Owner
Home Financials are based on the most recent Mortgage that was taken out on this home.
Original Mortgage
$820,000
Outstanding Balance
$800,511
Interest Rate
6.81%
Mortgage Type
New Conventional
Estimated Equity
$131,084
Purchase Details
Closed on
Dec 17, 2013
Sold by
Heber City Theatre Llc
Bought by
Provost Laren
Purchase Details
Closed on
Dec 10, 2013
Sold by
Lane James
Bought by
Proust Laren
Create a Home Valuation Report for This Property
The Home Valuation Report is an in-depth analysis detailing your home's value as well as a comparison with similar homes in the area
Home Values in the Area
Average Home Value in this Area
Purchase History
| Date | Buyer | Sale Price | Title Company |
|---|---|---|---|
| 113 N Main Llc | -- | First American Title Insurance | |
| Provost Laren | -- | None Available | |
| Proust Laren | -- | None Available |
Source: Public Records
Mortgage History
| Date | Status | Borrower | Loan Amount |
|---|---|---|---|
| Open | 113 N Main Llc | $820,000 |
Source: Public Records
Tax History Compared to Growth
Tax History
| Year | Tax Paid | Tax Assessment Tax Assessment Total Assessment is a certain percentage of the fair market value that is determined by local assessors to be the total taxable value of land and additions on the property. | Land | Improvement |
|---|---|---|---|---|
| 2025 | $7,587 | $820,000 | $200,000 | $620,000 |
| 2024 | $7,587 | $820,000 | $200,000 | $620,000 |
| 2023 | $7,587 | $820,000 | $200,000 | $620,000 |
| 2022 | $2,120 | $209,576 | $157,416 | $52,160 |
| 2021 | $2,669 | $209,576 | $157,416 | $52,160 |
| 2020 | $2,741 | $209,576 | $157,416 | $52,160 |
| 2019 | $2,597 | $209,576 | $0 | $0 |
| 2018 | $2,597 | $209,576 | $0 | $0 |
| 2017 | $2,611 | $209,576 | $0 | $0 |
| 2016 | $2,682 | $209,576 | $0 | $0 |
| 2015 | $2,557 | $209,576 | $157,416 | $52,160 |
| 2014 | $2,400 | $161,839 | $121,132 | $40,707 |
Source: Public Records
Map
Nearby Homes