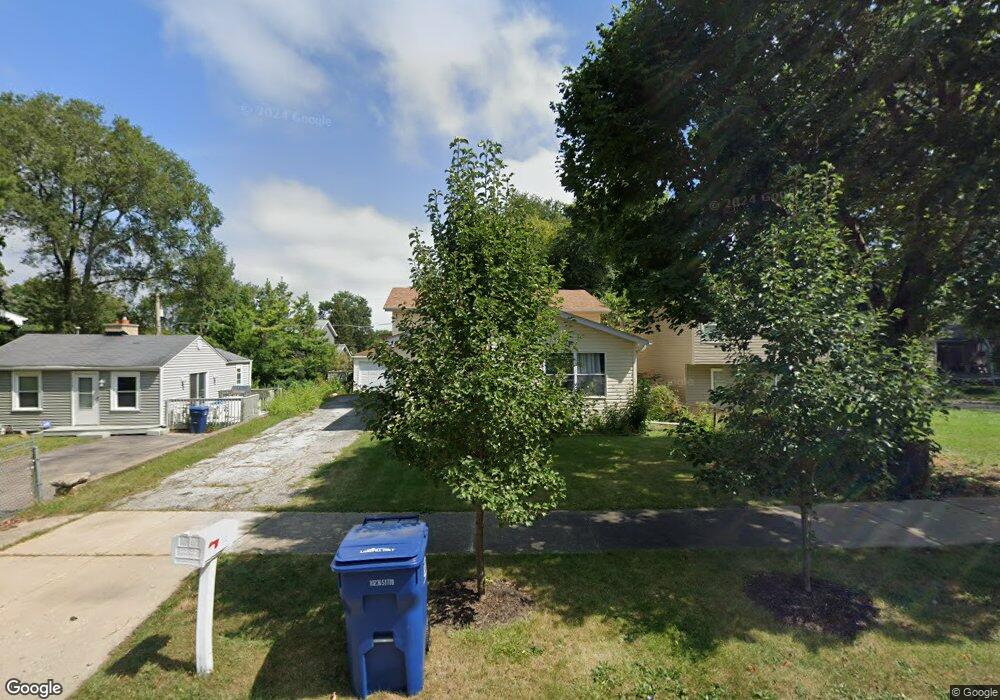
113 N Pioneer Rd Waukegan, IL 60085
Washington Hills NeighborhoodEstimated Value: $228,000 - $263,000
3
Beds
2
Baths
1,048
Sq Ft
$236/Sq Ft
Est. Value
About This Home
This home is located at 113 N Pioneer Rd, Waukegan, IL 60085 and is currently estimated at $247,758, approximately $236 per square foot. 113 N Pioneer Rd is a home located in Lake County with nearby schools including Whittier Elementary School, Robert E. Abbott Middle School, and Waukegan High School.
Ownership History
Date
Name
Owned For
Owner Type
Purchase Details
Closed on
Feb 5, 2001
Sold by
Uriostegui Maximino and Mendoza Bernabe
Bought by
Uriostegui Maximino
Current Estimated Value
Home Financials for this Owner
Home Financials are based on the most recent Mortgage that was taken out on this home.
Original Mortgage
$122,900
Outstanding Balance
$55,551
Interest Rate
10.5%
Estimated Equity
$192,207
Purchase Details
Closed on
Jan 31, 1996
Sold by
Baig Rasheed M and Baig Najmulsahar
Bought by
Uriostegui Maximino and Mendoza Bernabe
Home Financials for this Owner
Home Financials are based on the most recent Mortgage that was taken out on this home.
Original Mortgage
$108,071
Interest Rate
7.11%
Mortgage Type
FHA
Purchase Details
Closed on
Aug 11, 1995
Sold by
Baig Rasheed M and Baig Najmulsahar
Bought by
Baig Rasheed M and Baig Najmulsahar
Create a Home Valuation Report for This Property
The Home Valuation Report is an in-depth analysis detailing your home's value as well as a comparison with similar homes in the area
Home Values in the Area
Average Home Value in this Area
Purchase History
| Date | Buyer | Sale Price | Title Company |
|---|---|---|---|
| Uriostegui Maximino | -- | -- | |
| Uriostegui Maximino | $110,000 | -- | |
| Baig Rasheed M | -- | -- |
Source: Public Records
Mortgage History
| Date | Status | Borrower | Loan Amount |
|---|---|---|---|
| Open | Uriostegui Maximino | $122,900 | |
| Closed | Uriostegui Maximino | $108,071 |
Source: Public Records
Tax History Compared to Growth
Tax History
| Year | Tax Paid | Tax Assessment Tax Assessment Total Assessment is a certain percentage of the fair market value that is determined by local assessors to be the total taxable value of land and additions on the property. | Land | Improvement |
|---|---|---|---|---|
| 2024 | $4,986 | $67,992 | $9,195 | $58,797 |
| 2023 | $5,440 | $60,874 | $8,233 | $52,641 |
| 2022 | $5,440 | $61,645 | $7,585 | $54,060 |
| 2021 | $4,926 | $53,249 | $6,479 | $46,770 |
| 2020 | $4,943 | $49,608 | $6,036 | $43,572 |
| 2019 | $4,922 | $45,458 | $5,531 | $39,927 |
| 2018 | $4,411 | $40,497 | $7,119 | $33,378 |
| 2017 | $4,243 | $35,828 | $6,298 | $29,530 |
| 2016 | $3,884 | $31,133 | $5,473 | $25,660 |
| 2015 | $3,693 | $27,864 | $4,898 | $22,966 |
| 2014 | $3,866 | $28,389 | $5,111 | $23,278 |
| 2012 | $5,012 | $30,758 | $5,538 | $25,220 |
Source: Public Records
Map
Nearby Homes
- 24 Washington Terrace
- 102 Baldwin Ave
- 0 Brookside Ave
- 3170 W Monroe St Unit 309
- 2726 W Hidden Glen Dr
- 2115 Lydia St
- 615 Tiffany Dr
- 12601 W Atlantic Ave
- 2116 & 2101 Williamsburg Dr
- 621 N Austin Ave
- 49 S Lewis Ave
- 34887 N Austin Ave
- 603 N Austin Ave
- 132 Dorchester Ct
- 1213 Grand Ave
- 525 Lawrence Ave
- 12698 W Grandview Ave
- 12716 W Grandview Ave
- 1521 Catalpa Ave
- 3210 W Grandview Ave
- 111 N Pioneer Rd
- 115 N Pioneer Rd
- 109 N Pioneer Rd
- 114 Washington Terrace
- 112 Washington Terrace
- 116 Washington Terrace
- 107 N Pioneer Rd
- 110 Washington Terrace
- 117 N Pioneer Rd
- 118 Washington Terrace
- 112 N Pioneer Rd
- 114 N Pioneer Rd
- 116 N Pioneer Rd
- 110 N Pioneer Rd
- 105 N Pioneer Rd
- 118 N Pioneer Rd
- 106 Washington Terrace
- 120 Washington Terrace
- 106 N Pioneer Rd
- 111 Washington Terrace