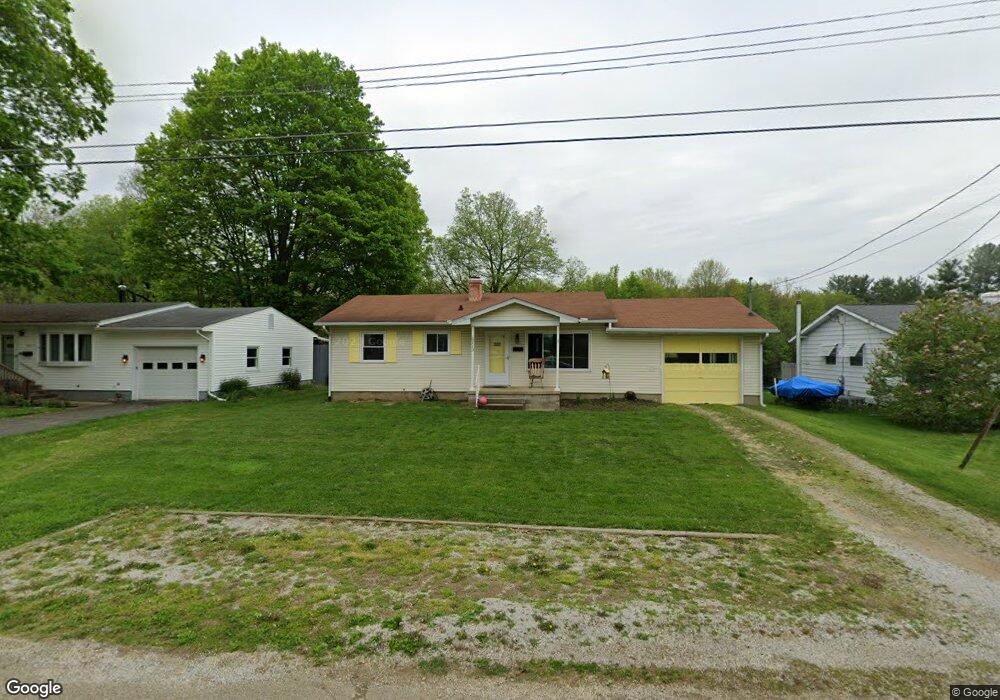
113 Northridge Dr Mount Vernon, OH 43050
Estimated Value: $192,000 - $205,000
2
Beds
1
Bath
875
Sq Ft
$228/Sq Ft
Est. Value
About This Home
This home is located at 113 Northridge Dr, Mount Vernon, OH 43050 and is currently estimated at $199,614, approximately $228 per square foot. 113 Northridge Dr is a home located in Knox County with nearby schools including Mount Vernon High School, St. Vincent de Paul School, and Ruscel Montessori Childrens House.
Ownership History
Date
Name
Owned For
Owner Type
Purchase Details
Closed on
Jun 6, 2019
Sold by
Jones Carol R
Bought by
Lauer Kelsey N and Lauer Gloria
Current Estimated Value
Home Financials for this Owner
Home Financials are based on the most recent Mortgage that was taken out on this home.
Original Mortgage
$104,850
Outstanding Balance
$92,374
Interest Rate
4.2%
Mortgage Type
Purchase Money Mortgage
Estimated Equity
$107,240
Purchase Details
Closed on
Aug 24, 2005
Sold by
Niemela Theodore L and Niemela Martha E
Bought by
Jones Carol R
Home Financials for this Owner
Home Financials are based on the most recent Mortgage that was taken out on this home.
Original Mortgage
$8,000
Interest Rate
5.8%
Mortgage Type
Future Advance Clause Open End Mortgage
Purchase Details
Closed on
Oct 6, 2003
Sold by
Weese Bernice B
Bought by
Niemela Theodore L and Niemela Mart
Purchase Details
Closed on
Aug 19, 1996
Sold by
Weese Robert J and Weese Bernice
Bought by
Weese Bernice B
Purchase Details
Closed on
Jun 15, 1989
Sold by
Stewart Daniel R and Stewart Marian
Bought by
Weese Robert J and Weese Bernice
Purchase Details
Closed on
Aug 10, 1987
Sold by
Shell Russell and Shell Shirley A
Bought by
Stewart Daniel R and Stewart Marian
Create a Home Valuation Report for This Property
The Home Valuation Report is an in-depth analysis detailing your home's value as well as a comparison with similar homes in the area
Home Values in the Area
Average Home Value in this Area
Purchase History
| Date | Buyer | Sale Price | Title Company |
|---|---|---|---|
| Lauer Kelsey N | $116,500 | -- | |
| Jones Carol R | $69,750 | None Available | |
| Niemela Theodore L | $88,300 | -- | |
| Weese Bernice B | -- | -- | |
| Weese Robert J | $55,000 | -- | |
| Stewart Daniel R | $49,000 | -- |
Source: Public Records
Mortgage History
| Date | Status | Borrower | Loan Amount |
|---|---|---|---|
| Open | Lauer Kelsey N | $104,850 | |
| Previous Owner | Jones Carol R | $8,000 |
Source: Public Records
Tax History Compared to Growth
Tax History
| Year | Tax Paid | Tax Assessment Tax Assessment Total Assessment is a certain percentage of the fair market value that is determined by local assessors to be the total taxable value of land and additions on the property. | Land | Improvement |
|---|---|---|---|---|
| 2024 | $1,889 | $48,980 | $7,560 | $41,420 |
| 2023 | $1,889 | $48,980 | $7,560 | $41,420 |
| 2022 | $1,495 | $35,240 | $5,440 | $29,800 |
| 2021 | $1,495 | $35,240 | $5,440 | $29,800 |
| 2020 | $1,457 | $35,240 | $5,440 | $29,800 |
| 2019 | $1,038 | $23,360 | $5,870 | $17,490 |
| 2018 | $1,038 | $23,360 | $5,870 | $17,490 |
| 2017 | $1,019 | $23,360 | $5,870 | $17,490 |
| 2016 | $946 | $21,630 | $5,440 | $16,190 |
| 2015 | $950 | $21,630 | $5,440 | $16,190 |
| 2014 | $954 | $21,630 | $5,440 | $16,190 |
| 2013 | $1,023 | $22,030 | $5,110 | $16,920 |
Source: Public Records
Map
Nearby Homes
- 109 Northridge Dr
- 107 Northridge Dr
- 200 Mansfield Rd
- 769 Upper Fredericktown Rd
- 9 Rose Ave
- 6 Miller Ave
- 717 N
- 800 N Sandusky St
- 33 Longitude Dr
- 12 Northview Dr
- 12567 Upper Fredericktown Rd
- 10 Yoakam Dr
- 812 N Gay St
- 300 1/2 Calhoun St
- 13 Mansfield Ave
- 7 Elizabeth St
- 00 Banning Rd
- 0 Banning Rd Unit 9067916
- 0 Banning Rd Unit 225030037
- 115 Northridge Dr
- 111 Northridge Dr
- 112 Northridge Dr
- 102 Clearview Dr
- 103 Clearview Dr
- 106 Northridge Dr
- 105 Northridge Dr
- 101 Clearview Dr
- 189 Mansfield Ave
- Lot # 232 Northridge Dr
- 104 Northridge Dr
- 109 Oakway Dr
- 99 Clearview Dr
- 103 Northridge Dr
- 107 Oakway Dr
- 102 Northridge Dr
- 105 Oakway Dr
- 101 Northridge Dr
- 100 Northridge Dr
- 103 Oakway Dr