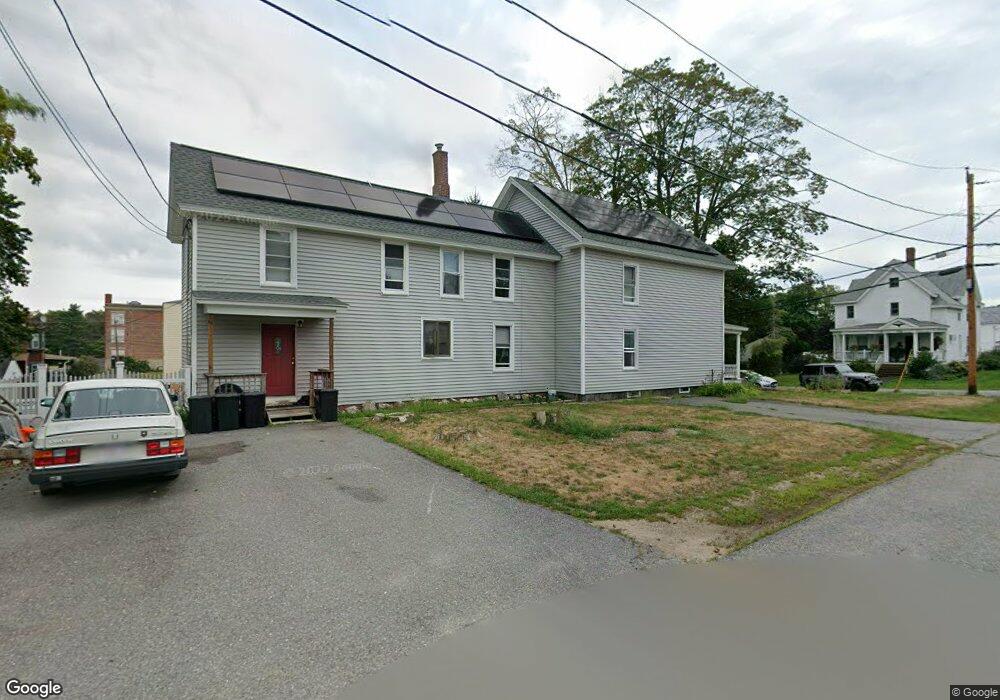
113 Oak St Unit 2 Winchendon, MA 01475
Estimated Value: $227,000 - $355,000
5
Beds
1
Bath
2,103
Sq Ft
$148/Sq Ft
Est. Value
About This Home
This home is located at 113 Oak St Unit 2, Winchendon, MA 01475 and is currently estimated at $311,685, approximately $148 per square foot. 113 Oak St Unit 2 is a home located in Worcester County with nearby schools including Toy Town Elementary School, Memorial, and The Winchendon School.
Ownership History
Date
Name
Owned For
Owner Type
Purchase Details
Closed on
Jan 31, 2019
Sold by
Dziedzinski Linda M
Bought by
Tilley James G and Tilley Amy R
Current Estimated Value
Home Financials for this Owner
Home Financials are based on the most recent Mortgage that was taken out on this home.
Original Mortgage
$132,050
Outstanding Balance
$116,330
Interest Rate
4.6%
Mortgage Type
New Conventional
Estimated Equity
$195,355
Purchase Details
Closed on
Aug 17, 2011
Sold by
Fnma
Bought by
Dziedzinski Linda M
Home Financials for this Owner
Home Financials are based on the most recent Mortgage that was taken out on this home.
Original Mortgage
$63,400
Interest Rate
4.62%
Mortgage Type
Purchase Money Mortgage
Purchase Details
Closed on
Aug 9, 2011
Sold by
Battista Joseph and Bank Of America Na
Bought by
Federal National Mortgage Association
Home Financials for this Owner
Home Financials are based on the most recent Mortgage that was taken out on this home.
Original Mortgage
$63,400
Interest Rate
4.62%
Mortgage Type
Purchase Money Mortgage
Purchase Details
Closed on
Sep 27, 2007
Sold by
Battista Flora
Bought by
Battista Joseph
Purchase Details
Closed on
Dec 17, 2004
Sold by
Dionne Craig B and Newell David E
Bought by
Battista Flora and Battista Joseph
Home Financials for this Owner
Home Financials are based on the most recent Mortgage that was taken out on this home.
Original Mortgage
$164,800
Interest Rate
5.68%
Mortgage Type
Purchase Money Mortgage
Purchase Details
Closed on
Jun 21, 2004
Sold by
Eqcc T 2 and Fairbanks Capital Corp
Bought by
Dionne Craig B and Newell David E
Purchase Details
Closed on
Jan 20, 2004
Sold by
Bank Of New York
Bought by
Bank Of New York
Purchase Details
Closed on
Oct 10, 2000
Sold by
Doyle Loredana
Bought by
Morgason David M
Create a Home Valuation Report for This Property
The Home Valuation Report is an in-depth analysis detailing your home's value as well as a comparison with similar homes in the area
Home Values in the Area
Average Home Value in this Area
Purchase History
| Date | Buyer | Sale Price | Title Company |
|---|---|---|---|
| Tilley James G | $139,000 | -- | |
| Tilley James G | $139,000 | -- | |
| Dziedzinski Linda M | $79,250 | -- | |
| Dziedzinski Linda M | $79,250 | -- | |
| Federal National Mortgage Association | $209,336 | -- | |
| Federal National Mortgage Association | $209,336 | -- | |
| Battista Joseph | -- | -- | |
| Battista Joseph | -- | -- | |
| Battista Flora | $206,000 | -- | |
| Battista Flora | $206,000 | -- | |
| Dionne Craig B | $125,000 | -- | |
| Dionne Craig B | $125,000 | -- | |
| Bank Of New York | $122,443 | -- | |
| Bank Of New York | $122,443 | -- | |
| Morgason David M | $117,900 | -- | |
| Morgason David M | $117,900 | -- |
Source: Public Records
Mortgage History
| Date | Status | Borrower | Loan Amount |
|---|---|---|---|
| Open | Tilley James G | $132,050 | |
| Closed | Tilley James G | $132,050 | |
| Previous Owner | Dziedzinski Linda M | $63,400 | |
| Previous Owner | Battista Flora | $164,800 |
Source: Public Records
Tax History Compared to Growth
Tax History
| Year | Tax Paid | Tax Assessment Tax Assessment Total Assessment is a certain percentage of the fair market value that is determined by local assessors to be the total taxable value of land and additions on the property. | Land | Improvement |
|---|---|---|---|---|
| 2025 | $2,847 | $242,300 | $32,100 | $210,200 |
| 2024 | $2,825 | $225,300 | $30,700 | $194,600 |
| 2023 | $2,022 | $150,900 | $30,000 | $120,900 |
| 2022 | $2,215 | $146,600 | $37,800 | $108,800 |
| 2021 | $2,320 | $147,600 | $34,400 | $113,200 |
| 2020 | $3,082 | $189,300 | $32,100 | $157,200 |
| 2019 | $2,933 | $175,500 | $29,700 | $145,800 |
| 2018 | $2,734 | $157,600 | $27,700 | $129,900 |
| 2017 | $2,816 | $156,700 | $32,500 | $124,200 |
| 2016 | $2,670 | $153,200 | $30,900 | $122,300 |
| 2015 | $2,562 | $153,200 | $30,900 | $122,300 |
| 2014 | $2,424 | $151,900 | $33,400 | $118,500 |
Source: Public Records
Map
Nearby Homes