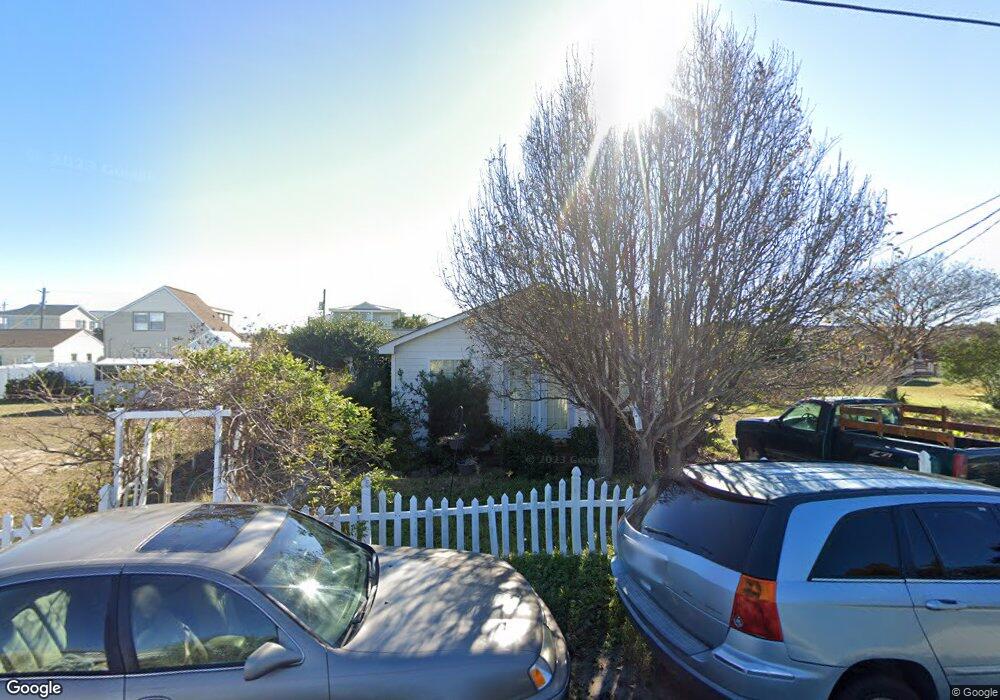
113 Oceanview Ln Carolina Beach, NC 28428
Estimated Value: $436,000 - $505,063
2
Beds
1
Bath
768
Sq Ft
$594/Sq Ft
Est. Value
About This Home
This home is located at 113 Oceanview Ln, Carolina Beach, NC 28428 and is currently estimated at $456,516, approximately $594 per square foot. 113 Oceanview Ln is a home located in New Hanover County with nearby schools including Carolina Beach Elementary School, Charles P. Murray Middle School, and Eugene Ashley High School.
Ownership History
Date
Name
Owned For
Owner Type
Purchase Details
Closed on
Mar 17, 2025
Sold by
Lyons Sharon
Bought by
James M Gilbert Inc
Current Estimated Value
Purchase Details
Closed on
May 22, 2007
Sold by
Durham Kaye Frances
Bought by
Lyons Sharon
Home Financials for this Owner
Home Financials are based on the most recent Mortgage that was taken out on this home.
Original Mortgage
$272,000
Interest Rate
7%
Mortgage Type
Purchase Money Mortgage
Purchase Details
Closed on
Nov 28, 2001
Sold by
Cherry Albert L
Bought by
Durham Kaye Frances
Purchase Details
Closed on
Jan 1, 2001
Bought by
Smith Edward C Clydie F
Purchase Details
Closed on
Oct 2, 1995
Sold by
Black L B Angela D
Bought by
Cherry Albert L Kaye D
Purchase Details
Closed on
Apr 8, 1994
Sold by
Smith Edward C Clydie F
Bought by
Black L B
Create a Home Valuation Report for This Property
The Home Valuation Report is an in-depth analysis detailing your home's value as well as a comparison with similar homes in the area
Home Values in the Area
Average Home Value in this Area
Purchase History
| Date | Buyer | Sale Price | Title Company |
|---|---|---|---|
| James M Gilbert Inc | $450,000 | None Listed On Document | |
| James M Gilbert Inc | $450,000 | None Listed On Document | |
| Lyons Sharon | $340,000 | None Available | |
| Durham Kaye Frances | -- | -- | |
| Smith Edward C Clydie F | -- | -- | |
| Cherry Albert L Kaye D | $62,000 | -- | |
| Black L B | $42,000 | -- |
Source: Public Records
Mortgage History
| Date | Status | Borrower | Loan Amount |
|---|---|---|---|
| Previous Owner | Lyons Sharon | $272,000 |
Source: Public Records
Tax History Compared to Growth
Tax History
| Year | Tax Paid | Tax Assessment Tax Assessment Total Assessment is a certain percentage of the fair market value that is determined by local assessors to be the total taxable value of land and additions on the property. | Land | Improvement |
|---|---|---|---|---|
| 2024 | $2,273 | $307,100 | $237,500 | $69,600 |
| 2023 | $2,198 | $307,100 | $237,500 | $69,600 |
| 2022 | $2,214 | $307,100 | $237,500 | $69,600 |
| 2021 | $2,275 | $307,100 | $237,500 | $69,600 |
| 2020 | $2,017 | $225,400 | $165,700 | $59,700 |
| 2019 | $2,093 | $233,900 | $165,700 | $68,200 |
| 2018 | $2,070 | $233,900 | $165,700 | $68,200 |
| 2017 | $2,000 | $233,900 | $165,700 | $68,200 |
| 2016 | $2,021 | $222,600 | $164,000 | $58,600 |
| 2015 | $1,860 | $222,600 | $164,000 | $58,600 |
| 2014 | $1,815 | $222,600 | $164,000 | $58,600 |
Source: Public Records
Map
Nearby Homes
- 116 Myrtle Ave
- 115 Hanby Ave Unit B
- 111 Hanby Ave
- 115 Hanby Ave Unit A
- 1101 Fort Fisher Blvd N Unit 3 & 4
- 110 Dow Ave
- 1701 Bowfin Ln Unit A
- 1701 Bowfin Ln Unit B
- 1701 Bowfin Ln Unit C
- 1701 Bowfin Ln Unit E
- 1722 Swordfish Ln Unit B
- 817 N Fort Fisher Blvd
- 1017 Trout Ln Unit B
- 114 Leeward Ct
- 822 Cutter Ct
- 1722 Bonito Ln
- 302 Alabama Ave Unit 2
- 813 Cutter Ct
- 304 Alabama Ave Unit 2
- 304 Alabama Ave Unit 1&2
- 110 Myrtle Ave
- 109 Ocean View Ave
- 117 Ocean View Ave
- 108 Myrtle Ave
- 112 Oceanview Ln
- 110 Ocean View Ave
- 117 Myrtle Ave
- 117 Myrtle Ave
- 129 Myrtle Ave
- 104 Myrtlewood Ct
- 104 Myrtle Ave
- 121 Ocean View Ave
- 121 Oceanview Ln
- 121 Ocean View Ave
- 106 Ocean View Ave Unit A
- 104 Ocean View Ave
- 106 Ocean View Ave Unit 104A
- 109 Myrtle Ave
- 107 Myrtle Ave
- 117 Hanby Ave