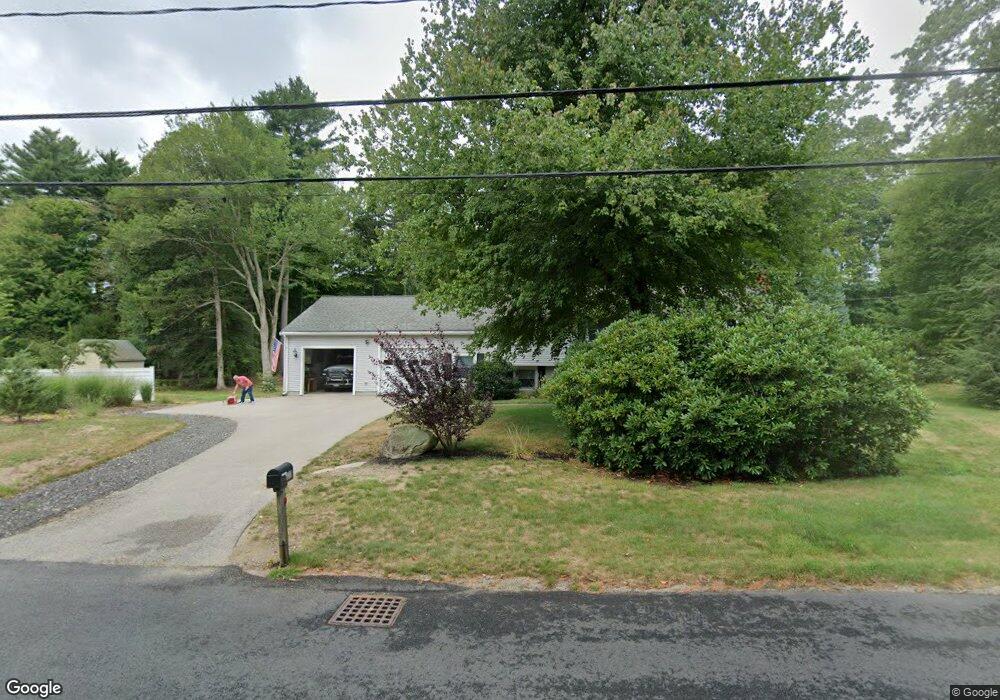
113 Old Farm Rd Hanover, MA 02339
Estimated Value: $693,629 - $881,000
3
Beds
2
Baths
1,686
Sq Ft
$461/Sq Ft
Est. Value
About This Home
This home is located at 113 Old Farm Rd, Hanover, MA 02339 and is currently estimated at $777,657, approximately $461 per square foot. 113 Old Farm Rd is a home located in Plymouth County with nearby schools including Hanover High School and The Master's Academy.
Ownership History
Date
Name
Owned For
Owner Type
Purchase Details
Closed on
Nov 16, 2020
Sold by
Gullage Judith A and Gullage Wayne V
Bought by
Gullage Judith A
Current Estimated Value
Purchase Details
Closed on
Mar 12, 1993
Sold by
Gerrior Brian J and Gerrior Karen J
Bought by
Gullage Judith A and Gullage Wayne
Home Financials for this Owner
Home Financials are based on the most recent Mortgage that was taken out on this home.
Original Mortgage
$139,400
Interest Rate
7.8%
Mortgage Type
Purchase Money Mortgage
Create a Home Valuation Report for This Property
The Home Valuation Report is an in-depth analysis detailing your home's value as well as a comparison with similar homes in the area
Home Values in the Area
Average Home Value in this Area
Purchase History
| Date | Buyer | Sale Price | Title Company |
|---|---|---|---|
| Gullage Judith A | -- | None Available | |
| Gullage Judith A | $165,000 | -- |
Source: Public Records
Mortgage History
| Date | Status | Borrower | Loan Amount |
|---|---|---|---|
| Previous Owner | Gullage Judith A | $155,000 | |
| Previous Owner | Gullage Judith A | $40,000 | |
| Previous Owner | Gullage Judith A | $180,000 | |
| Previous Owner | Gullage Judith A | $139,400 |
Source: Public Records
Tax History Compared to Growth
Tax History
| Year | Tax Paid | Tax Assessment Tax Assessment Total Assessment is a certain percentage of the fair market value that is determined by local assessors to be the total taxable value of land and additions on the property. | Land | Improvement |
|---|---|---|---|---|
| 2025 | $7,979 | $646,100 | $269,400 | $376,700 |
| 2024 | $7,957 | $619,700 | $269,400 | $350,300 |
| 2023 | $7,834 | $580,700 | $244,900 | $335,800 |
| 2022 | $7,540 | $494,400 | $244,900 | $249,500 |
| 2021 | $7,394 | $452,800 | $222,600 | $230,200 |
| 2020 | $7,320 | $448,800 | $222,600 | $226,200 |
| 2019 | $6,845 | $417,100 | $222,600 | $194,500 |
| 2018 | $5,945 | $417,700 | $222,600 | $195,100 |
| 2017 | $6,339 | $383,700 | $209,500 | $174,200 |
| 2016 | $6,149 | $364,700 | $190,500 | $174,200 |
| 2015 | $5,363 | $332,100 | $190,500 | $141,600 |
Source: Public Records
Map
Nearby Homes