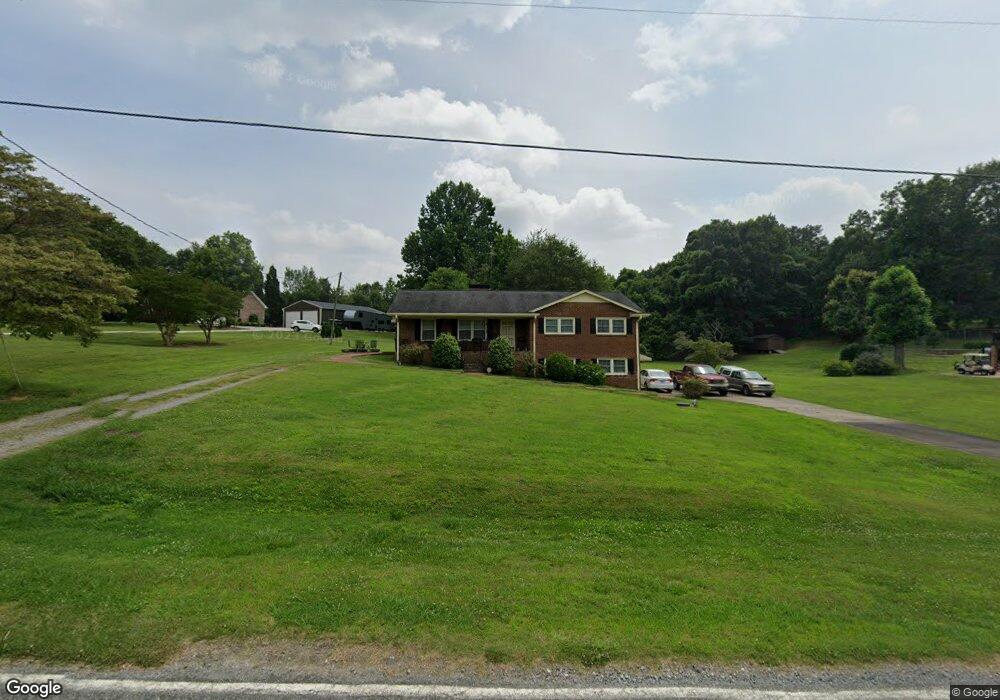
113 Phifer Cir Kings Mountain, NC 28086
Estimated Value: $266,000 - $346,000
--
Bed
--
Bath
1,870
Sq Ft
$163/Sq Ft
Est. Value
About This Home
This home is located at 113 Phifer Cir, Kings Mountain, NC 28086 and is currently estimated at $305,598, approximately $163 per square foot. 113 Phifer Cir is a home located in Cleveland County with nearby schools including Bethware Elementary School, Kings Mountain Middle, and Kings Mountain Intermediate School.
Ownership History
Date
Name
Owned For
Owner Type
Purchase Details
Closed on
Jul 8, 2005
Sold by
Wachovia Bank N A
Bought by
Belcher Ronald Allan and Belcher Deborah Renee
Current Estimated Value
Home Financials for this Owner
Home Financials are based on the most recent Mortgage that was taken out on this home.
Original Mortgage
$83,400
Outstanding Balance
$43,339
Interest Rate
5.59%
Mortgage Type
New Conventional
Estimated Equity
$262,259
Purchase Details
Closed on
May 26, 2005
Sold by
Priority Trustee Services Of Nc Llc
Bought by
Mortgage Electronic Registration Systems
Home Financials for this Owner
Home Financials are based on the most recent Mortgage that was taken out on this home.
Original Mortgage
$83,400
Outstanding Balance
$43,339
Interest Rate
5.59%
Mortgage Type
New Conventional
Estimated Equity
$262,259
Create a Home Valuation Report for This Property
The Home Valuation Report is an in-depth analysis detailing your home's value as well as a comparison with similar homes in the area
Home Values in the Area
Average Home Value in this Area
Purchase History
| Date | Buyer | Sale Price | Title Company |
|---|---|---|---|
| Belcher Ronald Allan | $113,500 | None Available | |
| Wachovia Bank N A | -- | None Available | |
| Mortgage Electronic Registration Systems | $122,000 | None Available |
Source: Public Records
Mortgage History
| Date | Status | Borrower | Loan Amount |
|---|---|---|---|
| Open | Wachovia Bank N A | $83,400 | |
| Closed | Belcher Ronald Allan | $83,400 |
Source: Public Records
Tax History Compared to Growth
Tax History
| Year | Tax Paid | Tax Assessment Tax Assessment Total Assessment is a certain percentage of the fair market value that is determined by local assessors to be the total taxable value of land and additions on the property. | Land | Improvement |
|---|---|---|---|---|
| 2025 | $1,493 | $235,048 | $20,000 | $215,048 |
| 2024 | $1,244 | $146,384 | $17,000 | $129,384 |
| 2023 | $1,238 | $146,384 | $17,000 | $129,384 |
| 2022 | $1,238 | $146,384 | $17,000 | $129,384 |
| 2021 | $1,242 | $146,384 | $17,000 | $129,384 |
| 2020 | $1,080 | $121,595 | $15,750 | $105,845 |
| 2019 | $1,080 | $121,595 | $15,750 | $105,845 |
| 2018 | $1,076 | $121,595 | $15,750 | $105,845 |
| 2017 | $1,070 | $121,595 | $15,750 | $105,845 |
| 2016 | $1,023 | $121,595 | $15,750 | $105,845 |
| 2015 | $1,101 | $131,481 | $15,000 | $116,481 |
| 2014 | $1,101 | $131,481 | $15,000 | $116,481 |
Source: Public Records
Map
Nearby Homes
- 411 El Bethel Rd
- 000 Bethlehem Rd
- 400 El Bethel Rd
- 106 Raintree Dr
- 163 Kipling Ln
- 180 Rosedale St
- 226 Caley St
- 1425 Bethlehem Rd
- 907 Bethlehem Rd
- 223 Frank Burns Way
- 107 Frank Burns Way
- 107 Tara Terrace
- 262 Frank Burns Way
- 215 Chadwick Dr
- 813 Bethlehem Rd
- 143 Yarbro Rd Unit 2
- 114 Yarbro Rd Unit 23
- 115 El Bethel Rd
- 707 Sandalwood Ln
- 802 Bethlehem Rd Unit 5
- 117 Phifer Cir
- 111 Phifer Cir
- 119 Phifer Cir
- 106 Phifer Cir
- 116 Phifer Cir
- 120 Phifer Cir
- 121 Piper Dr
- 123 Piper Dr
- 1336 Phifer Rd
- 126 Phifer Cir
- 1339 Phifer Rd Unit 1
- 1339 Phifer Rd
- 1407 Phifer Rd
- 127 Phifer Cir
- 1402 Phifer Rd
- 122 Camelot Ct
- 118 Camelot Ct
- 129 Phifer Cir
- 826 Warlick Rd
- 128 Phifer Cir