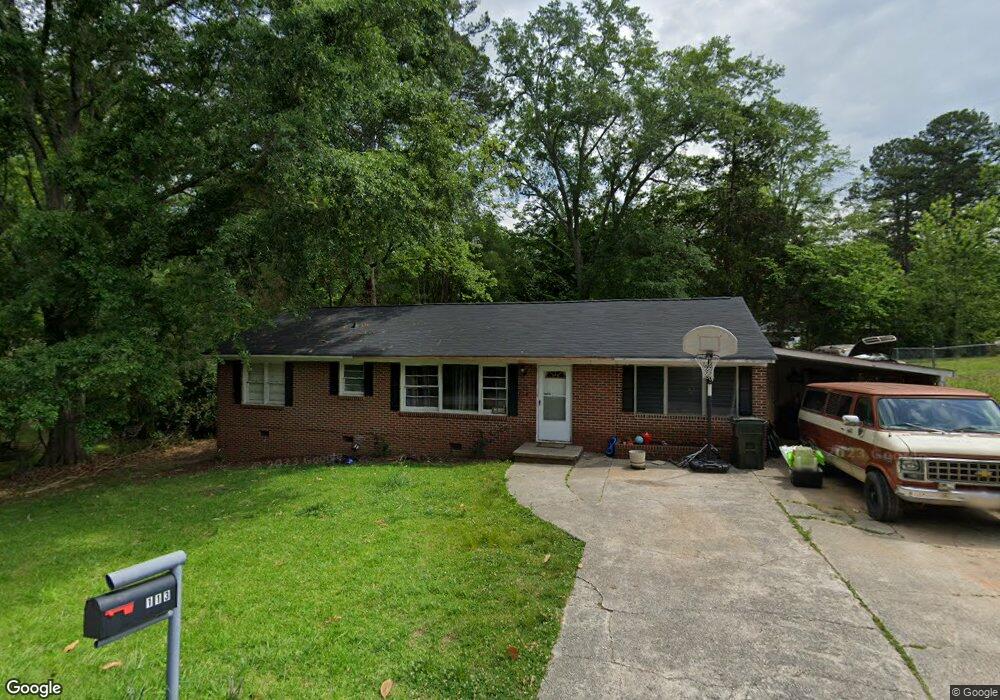
113 Poplar St Toccoa, GA 30577
Estimated Value: $192,938 - $204,000
3
Beds
1
Bath
1,291
Sq Ft
$152/Sq Ft
Est. Value
About This Home
This home is located at 113 Poplar St, Toccoa, GA 30577 and is currently estimated at $196,735, approximately $152 per square foot. 113 Poplar St is a home located in Stephens County with nearby schools including Stephens County High School.
Ownership History
Date
Name
Owned For
Owner Type
Purchase Details
Closed on
Sep 29, 2021
Sold by
Fulbright Michael Gene
Bought by
Klements Christopher
Current Estimated Value
Home Financials for this Owner
Home Financials are based on the most recent Mortgage that was taken out on this home.
Original Mortgage
$132,323
Outstanding Balance
$119,878
Interest Rate
2.8%
Mortgage Type
New Conventional
Estimated Equity
$76,857
Purchase Details
Closed on
Mar 17, 2011
Sold by
Waters Jessica
Bought by
Fulbright Michael Gene
Purchase Details
Closed on
Nov 2, 2009
Sold by
Fulbright Michael Gene
Bought by
Waters Jessica
Home Financials for this Owner
Home Financials are based on the most recent Mortgage that was taken out on this home.
Original Mortgage
$71,500
Interest Rate
4.93%
Mortgage Type
New Conventional
Purchase Details
Closed on
Mar 1, 1996
Bought by
<Buyer Info Not Present>
Purchase Details
Closed on
Feb 1, 1992
Bought by
<Buyer Info Not Present>
Create a Home Valuation Report for This Property
The Home Valuation Report is an in-depth analysis detailing your home's value as well as a comparison with similar homes in the area
Purchase History
| Date | Buyer | Sale Price | Title Company |
|---|---|---|---|
| Klements Christopher | $131,000 | -- | |
| Fulbright Michael Gene | -- | -- | |
| Waters Jessica | $75,000 | -- | |
| <Buyer Info Not Present> | $38,000 | -- | |
| <Buyer Info Not Present> | -- | -- |
Source: Public Records
Mortgage History
| Date | Status | Borrower | Loan Amount |
|---|---|---|---|
| Open | Klements Christopher | $132,323 | |
| Previous Owner | Waters Jessica | $71,500 |
Source: Public Records
Tax History
| Year | Tax Paid | Tax Assessment Tax Assessment Total Assessment is a certain percentage of the fair market value that is determined by local assessors to be the total taxable value of land and additions on the property. | Land | Improvement |
|---|---|---|---|---|
| 2025 | $2,168 | $62,127 | $2,043 | $60,084 |
| 2024 | $1,418 | $39,770 | $2,043 | $37,727 |
| 2023 | $1,300 | $36,752 | $2,043 | $34,709 |
| 2022 | $1,026 | $34,465 | $2,043 | $32,422 |
| 2021 | $729 | $23,309 | $2,043 | $21,266 |
| 2020 | $732 | $23,173 | $2,043 | $21,130 |
| 2019 | $735 | $23,173 | $2,043 | $21,130 |
| 2018 | $735 | $23,173 | $2,043 | $21,130 |
| 2017 | $746 | $23,173 | $2,043 | $21,130 |
| 2016 | $735 | $23,172 | $2,042 | $21,129 |
| 2015 | $766 | $23,061 | $2,042 | $21,018 |
| 2014 | $779 | $23,061 | $2,043 | $21,018 |
| 2013 | -- | $23,490 | $2,042 | $21,447 |
Source: Public Records
Map
Nearby Homes
- 9 Poplar St
- 27 Hilltop Ln
- 481 Collins Rd
- 253 Stancil Dr
- 59 Sunset Ln
- 122 King St
- 0 Valley Dr Unit 10701357
- 30 Moore Ave
- 526 Poplar St
- 93 Hickory Cir
- 128 Branch St
- 500 S Pond St
- 478 S Pond St
- 614 616 S Pond St
- 704 Skyline Dr
- 943 S Pond St
- 320 S Pond St
- 574 S Sage St
- 0 Hwy 17 Alt Unit 10577119
- 157 Taylor St
Your Personal Tour Guide
Ask me questions while you tour the home.