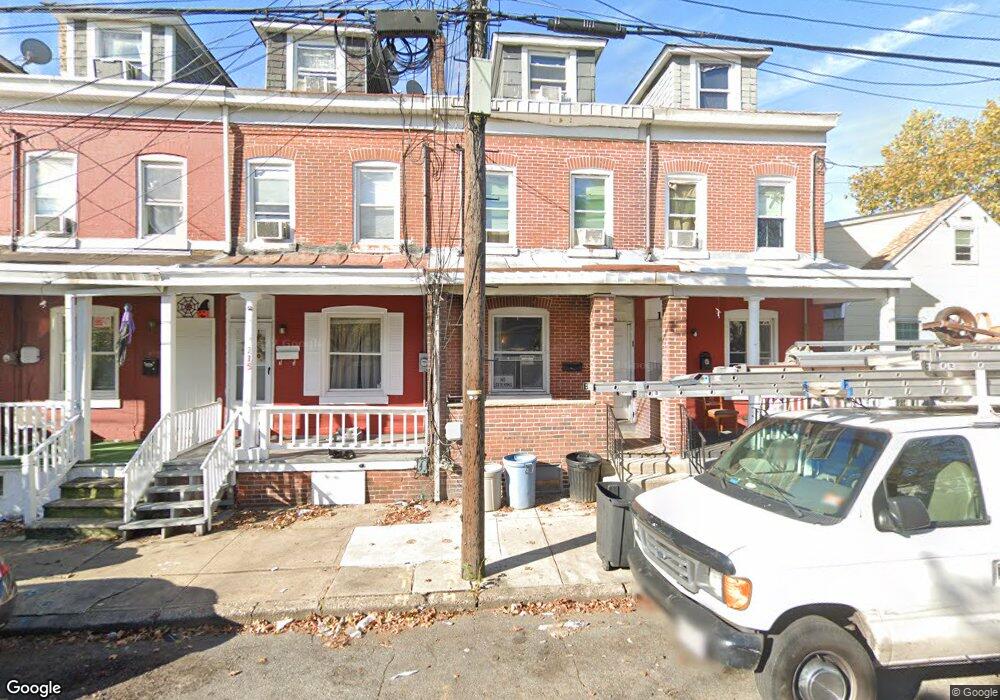
113 Randall Ave Trenton, NJ 08611
South Trenton NeighborhoodEstimated Value: $101,000 - $192,000
--
Bed
--
Bath
969
Sq Ft
$165/Sq Ft
Est. Value
About This Home
This home is located at 113 Randall Ave, Trenton, NJ 08611 and is currently estimated at $159,945, approximately $165 per square foot. 113 Randall Ave is a home located in Mercer County with nearby schools including Mott Elementary School, Parker Elementary School, and Dr. Crosby Copeland Elementary School.
Ownership History
Date
Name
Owned For
Owner Type
Purchase Details
Closed on
Mar 12, 2021
Sold by
Abrahams Gary and Abrahams Prita
Bought by
Grand 140 Properties Llc
Current Estimated Value
Purchase Details
Closed on
Aug 10, 2006
Sold by
D & I Properties Inc
Bought by
Abrahams Gary and Abrahams Prita
Home Financials for this Owner
Home Financials are based on the most recent Mortgage that was taken out on this home.
Original Mortgage
$72,675
Interest Rate
6.88%
Purchase Details
Closed on
Sep 11, 2003
Sold by
D'Onofrio John
Bought by
D&I Properties
Purchase Details
Closed on
Feb 4, 2003
Sold by
Us Bank
Bought by
O'Donofrio John
Create a Home Valuation Report for This Property
The Home Valuation Report is an in-depth analysis detailing your home's value as well as a comparison with similar homes in the area
Home Values in the Area
Average Home Value in this Area
Purchase History
| Date | Buyer | Sale Price | Title Company |
|---|---|---|---|
| Grand 140 Properties Llc | $55,000 | Surety Ttl Svcs North Region | |
| Abrahams Gary | $78,000 | -- | |
| D&I Properties | $33,900 | -- | |
| O'Donofrio John | $33,900 | -- |
Source: Public Records
Mortgage History
| Date | Status | Borrower | Loan Amount |
|---|---|---|---|
| Previous Owner | Abrahams Gary | $72,675 |
Source: Public Records
Tax History Compared to Growth
Tax History
| Year | Tax Paid | Tax Assessment Tax Assessment Total Assessment is a certain percentage of the fair market value that is determined by local assessors to be the total taxable value of land and additions on the property. | Land | Improvement |
|---|---|---|---|---|
| 2025 | $2,848 | $49,100 | $8,400 | $40,700 |
| 2024 | $2,733 | $49,100 | $8,400 | $40,700 |
| 2023 | $2,733 | $49,100 | $8,400 | $40,700 |
| 2022 | $2,680 | $49,100 | $8,400 | $40,700 |
| 2021 | $2,727 | $49,100 | $8,400 | $40,700 |
| 2020 | $2,718 | $49,100 | $8,400 | $40,700 |
| 2019 | $2,674 | $49,100 | $8,400 | $40,700 |
| 2018 | $2,560 | $49,100 | $8,400 | $40,700 |
| 2017 | $2,433 | $49,100 | $8,400 | $40,700 |
| 2016 | $3,705 | $64,400 | $14,800 | $49,600 |
| 2015 | $3,692 | $64,400 | $14,800 | $49,600 |
| 2014 | $3,675 | $64,400 | $14,800 | $49,600 |
Source: Public Records
Map
Nearby Homes