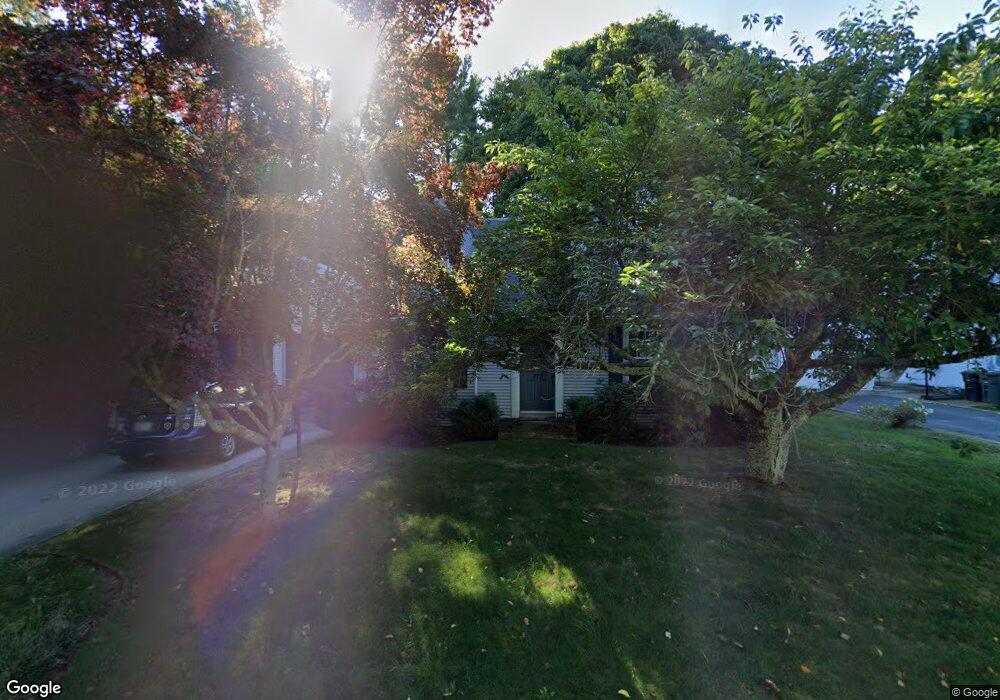
113 Rathbun St Coventry, RI 02816
Estimated Value: $388,000 - $457,000
2
Beds
2
Baths
1,736
Sq Ft
$238/Sq Ft
Est. Value
About This Home
This home is located at 113 Rathbun St, Coventry, RI 02816 and is currently estimated at $412,689, approximately $237 per square foot. 113 Rathbun St is a home located in Kent County with nearby schools including Alan Shawn Feinstein Ms Of Cov, Coventry High School, and Father John V. Doyle School.
Ownership History
Date
Name
Owned For
Owner Type
Purchase Details
Closed on
Jun 21, 2017
Sold by
Ruggiero James A
Bought by
Ruggiero James A and Ruggiero Diana P
Current Estimated Value
Purchase Details
Closed on
Sep 16, 2011
Sold by
Harbeck Douglas P and Harbeck Dawn M
Bought by
Ruggiero James A
Purchase Details
Closed on
Sep 1, 2005
Sold by
Jacques Peter G and Jacques Gloria J
Bought by
Harbeck Douglas P and Harbeck Dawn M
Create a Home Valuation Report for This Property
The Home Valuation Report is an in-depth analysis detailing your home's value as well as a comparison with similar homes in the area
Purchase History
| Date | Buyer | Sale Price | Title Company |
|---|---|---|---|
| Ruggiero James A | -- | -- | |
| Ruggiero James A | $119,000 | -- | |
| Harbeck Douglas P | $285,000 | -- |
Source: Public Records
Mortgage History
| Date | Status | Borrower | Loan Amount |
|---|---|---|---|
| Previous Owner | Harbeck Douglas P | $142,621 | |
| Previous Owner | Harbeck Douglas P | $311,784 |
Source: Public Records
Tax History
| Year | Tax Paid | Tax Assessment Tax Assessment Total Assessment is a certain percentage of the fair market value that is determined by local assessors to be the total taxable value of land and additions on the property. | Land | Improvement |
|---|---|---|---|---|
| 2025 | $4,996 | $310,500 | $92,400 | $218,100 |
| 2024 | $4,918 | $310,500 | $92,400 | $218,100 |
| 2023 | $4,760 | $310,500 | $92,400 | $218,100 |
| 2022 | $4,276 | $218,500 | $85,800 | $132,700 |
| 2021 | $4,239 | $218,500 | $85,800 | $132,700 |
| 2020 | $4,859 | $218,500 | $85,800 | $132,700 |
| 2019 | $4,248 | $191,000 | $72,800 | $118,200 |
| 2018 | $4,128 | $191,000 | $72,800 | $118,200 |
| 2017 | $4,007 | $191,000 | $72,800 | $118,200 |
| 2016 | $3,623 | $169,200 | $59,300 | $109,900 |
| 2015 | $3,524 | $169,200 | $59,300 | $109,900 |
| 2014 | $3,451 | $169,200 | $59,300 | $109,900 |
| 2013 | $3,838 | $205,700 | $81,100 | $124,600 |
Source: Public Records
Map
Nearby Homes
- 109 Rathbun St
- 117 Rathbun St
- 20 Woodland Ave
- 18 Woodland Ave
- 30 Woodland Ave
- 184 S Main St
- 105 Rathbun St
- 172 S Main St
- 118 Rathbun St
- 10 Woodland Ave
- 131 Rathbun St
- 188 S Main St
- 22 Rathbun St (Anthony) St
- 1 Dell St
- 25 Woodland Ave
- 164 S Main St
- 17 Woodland Ave
- 15 Woodland Ave
- 130 Rathbun St
- 181 S Main St
Your Personal Tour Guide
Ask me questions while you tour the home.