Estimated Value: $281,704 - $344,000
4
Beds
3
Baths
2,246
Sq Ft
$133/Sq Ft
Est. Value
About This Home
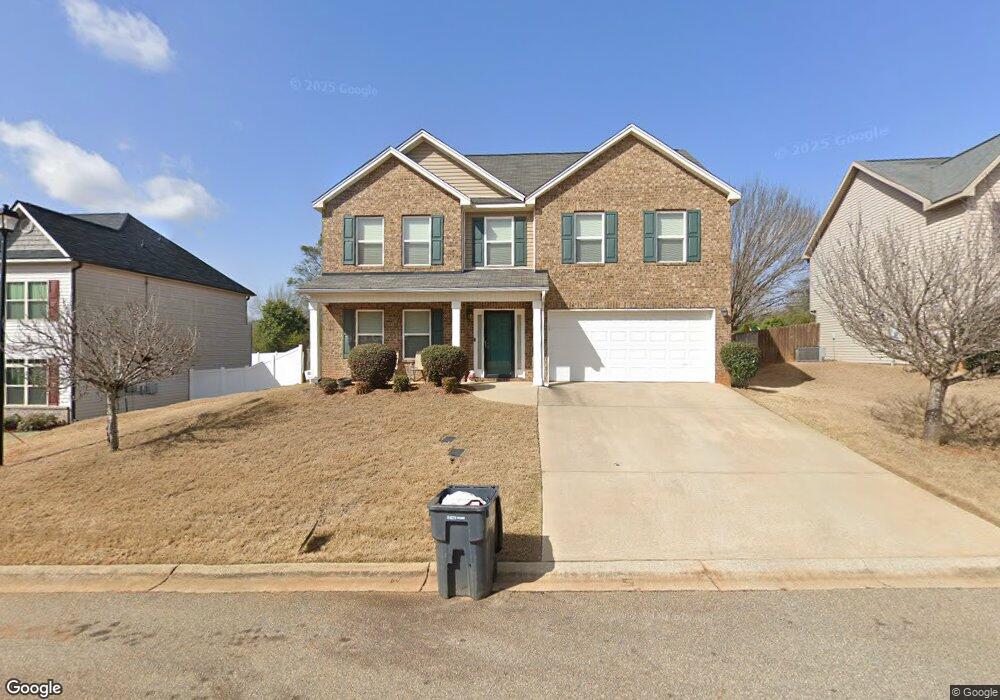
This home is located at 113 Rippling Water Way, Perry, GA 31069 and is currently estimated at $298,426, approximately $132 per square foot. 113 Rippling Water Way is a home with nearby schools including Langston Road Elementary School, Mossy Creek Middle School, and Perry High School.
Ownership History
Date
Name
Owned For
Owner Type
Purchase Details
Closed on
Aug 31, 2011
Sold by
Sf Communities Llc
Bought by
Wright Joseph A
Current Estimated Value
Home Financials for this Owner
Home Financials are based on the most recent Mortgage that was taken out on this home.
Original Mortgage
$156,533
Outstanding Balance
$108,565
Interest Rate
4.53%
Mortgage Type
New Conventional
Estimated Equity
$189,861
Purchase Details
Closed on
May 6, 2011
Sold by
Planters First
Bought by
Langston Place Development Llc
Home Financials for this Owner
Home Financials are based on the most recent Mortgage that was taken out on this home.
Original Mortgage
$113,250
Interest Rate
4.83%
Mortgage Type
Construction
Purchase Details
Closed on
Mar 4, 1998
Sold by
Fowler Toby W and Fowler Clara L
Bought by
Tomlinson Norman T and Tomlinson Donna R
Purchase Details
Closed on
Apr 6, 1979
Sold by
Chapman C David
Bought by
Wisher Danny H and Wisher Fay S
Purchase Details
Closed on
Dec 4, 1970
Sold by
Marshall A Smoak
Bought by
Hill Robert A
Create a Home Valuation Report for This Property
The Home Valuation Report is an in-depth analysis detailing your home's value as well as a comparison with similar homes in the area
Home Values in the Area
Average Home Value in this Area
Purchase History
| Date | Buyer | Sale Price | Title Company |
|---|---|---|---|
| Wright Joseph A | $151,100 | None Available | |
| Langston Place Development Llc | -- | None Available | |
| Sf Communities Llc | $10,900 | None Available | |
| Tomlinson Norman T | $91,500 | -- | |
| Wisher Danny H | -- | -- | |
| Hill Robert A | -- | -- |
Source: Public Records
Mortgage History
| Date | Status | Borrower | Loan Amount |
|---|---|---|---|
| Open | Wright Joseph A | $156,533 | |
| Previous Owner | Sf Communities Llc | $113,250 |
Source: Public Records
Tax History Compared to Growth
Tax History
| Year | Tax Paid | Tax Assessment Tax Assessment Total Assessment is a certain percentage of the fair market value that is determined by local assessors to be the total taxable value of land and additions on the property. | Land | Improvement |
|---|---|---|---|---|
| 2024 | $3,573 | $97,240 | $10,000 | $87,240 |
| 2023 | $3,193 | $86,320 | $10,000 | $76,320 |
| 2022 | $1,802 | $78,360 | $10,000 | $68,360 |
| 2021 | $1,557 | $67,360 | $10,000 | $57,360 |
| 2020 | $1,435 | $61,760 | $10,000 | $51,760 |
| 2019 | $1,435 | $61,760 | $10,000 | $51,760 |
| 2018 | $1,435 | $61,760 | $10,000 | $51,760 |
| 2017 | $1,343 | $57,760 | $6,000 | $51,760 |
| 2016 | $1,345 | $57,760 | $6,000 | $51,760 |
| 2015 | $1,364 | $58,440 | $6,000 | $52,440 |
| 2014 | -- | $58,440 | $6,000 | $52,440 |
| 2013 | -- | $58,440 | $6,000 | $52,440 |
Source: Public Records
Map
Nearby Homes
- 118 Bramblewood Way
- 128 Bramblewood Ln
- 124 Bramblewood Ln
- 103 Breakwater Way
- 107 Breakwater Way
- 111 Breakwater Way
- 210 Overton Dr
- 220 Overton Dr
- Savannah Plan at Bankstone Landing
- Newport Plan at Bankstone Landing
- Delaware Plan at Bankstone Landing
- 219 Overton Dr
- 302 Brampton Way
- 3004 Cellar Ln
- 0 Hwy 41 & Langston Rd Unit M170042
- 0 Langston Rd Unit 16828609
- 161 Overton Dr
- 309 E River Cane Run
- 114 Sutton Dr
- 3054 Cellar Ln
- 111 Rippling Water Way
- 115 Rippling Water Way
- 117 Rippling Water Way
- 118 Rippling Water Way
- 119 Rippling Water Way
- 463 Langston Rd
- 120 Rippling Water Way
- 121 Rippling Water Way
- 455 Langston Rd
- 123 Rippling Water Way
- 200 Rippling Water Way
- 103 Bramblewood Ln
- 102 Breakwater Way
- 201 Rippling Water Way
- 110 Breakwater Way
- 202 Rippling Water Way
- 203 Rippling Water Way
- 451 Langston Rd
- 204 Rippling Water Way
- 205 Rippling Water Way