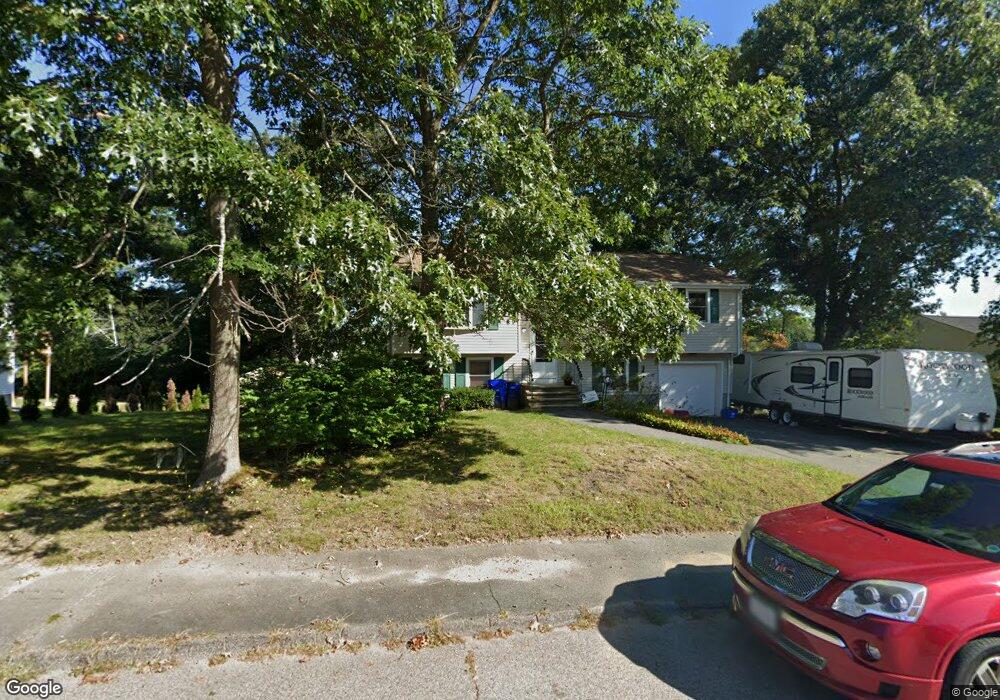
113 Roberts Ave Holbrook, MA 02343
Estimated Value: $598,000 - $663,000
3
Beds
1
Bath
1,820
Sq Ft
$347/Sq Ft
Est. Value
About This Home
This home is located at 113 Roberts Ave, Holbrook, MA 02343 and is currently estimated at $630,811, approximately $346 per square foot. 113 Roberts Ave is a home located in Norfolk County with nearby schools including John F. Kennedy Elementary School, Holbrook Middle High School, and Boston Higashi School.
Ownership History
Date
Name
Owned For
Owner Type
Purchase Details
Closed on
Dec 29, 1995
Sold by
Mjb Homes Inc
Bought by
Ming Paula A
Current Estimated Value
Home Financials for this Owner
Home Financials are based on the most recent Mortgage that was taken out on this home.
Original Mortgage
$132,900
Outstanding Balance
$3,600
Interest Rate
7.33%
Mortgage Type
Purchase Money Mortgage
Estimated Equity
$627,211
Create a Home Valuation Report for This Property
The Home Valuation Report is an in-depth analysis detailing your home's value as well as a comparison with similar homes in the area
Home Values in the Area
Average Home Value in this Area
Purchase History
| Date | Buyer | Sale Price | Title Company |
|---|---|---|---|
| Ming Paula A | $139,000 | -- | |
| Ming Paula A | $139,000 | -- |
Source: Public Records
Mortgage History
| Date | Status | Borrower | Loan Amount |
|---|---|---|---|
| Open | Ming Paula A | $132,900 | |
| Closed | Ming Paula A | $132,900 |
Source: Public Records
Tax History Compared to Growth
Tax History
| Year | Tax Paid | Tax Assessment Tax Assessment Total Assessment is a certain percentage of the fair market value that is determined by local assessors to be the total taxable value of land and additions on the property. | Land | Improvement |
|---|---|---|---|---|
| 2025 | $69 | $522,700 | $217,400 | $305,300 |
| 2024 | $6,466 | $481,100 | $197,600 | $283,500 |
| 2023 | $6,858 | $445,900 | $179,700 | $266,200 |
| 2022 | $6,459 | $391,700 | $156,200 | $235,500 |
| 2021 | $6,339 | $368,100 | $146,000 | $222,100 |
| 2020 | $6,529 | $355,400 | $139,000 | $216,400 |
| 2019 | $6,365 | $327,100 | $123,900 | $203,200 |
| 2018 | $6,211 | $300,500 | $105,000 | $195,500 |
| 2017 | $6,080 | $290,900 | $105,000 | $185,900 |
| 2016 | $5,874 | $299,100 | $117,000 | $182,100 |
| 2015 | $5,428 | $284,500 | $110,000 | $174,500 |
| 2014 | $5,008 | $266,800 | $100,000 | $166,800 |
Source: Public Records
Map
Nearby Homes
- 63 Cedarhill Rd
- 5 Clarendon Cir Unit Lot 4
- 27 Winter St
- 7 Morton Rd
- 46 Wilmarth Rd
- 327 Union St
- 229 Mill St
- 217 Mill St
- 148 N Franklin St
- 346 South St
- 58 Chandler St
- 314 South St
- 5 Patterson Ave E
- 187 Belcher St
- 10 Alfred Terrace
- 276 Center St
- 152 S Franklin St
- 373 N Franklin St
- 40 Overlook Rd
- 4 Evan Cain Way
- 111 Roberts Ave
- 115 Roberts Ave
- 128 Roberts Ave
- 61 Westdale Rd Unit Lot 72
- 130 Roberts Ave
- 126 Roberts Ave
- 117 Roberts Ave
- 109 Roberts Ave
- 4 Westdale Terrace
- 8 Westdale Terrace
- 8 Westdale Terrace Unit 8
- 132 Roberts Ave
- 124 Roberts Ave
- 47 Mount Pleasant Ave
- 65 Westdale Rd Unit 65
- 68 Westdale Rd
- 51 Mount Pleasant Ave
- 119 Roberts Ave
- 45 Mount Pleasant Ave
- 107 Roberts Ave