Estimated Value: $98,000 - $202,000
3
Beds
2
Baths
1,879
Sq Ft
$85/Sq Ft
Est. Value
About This Home
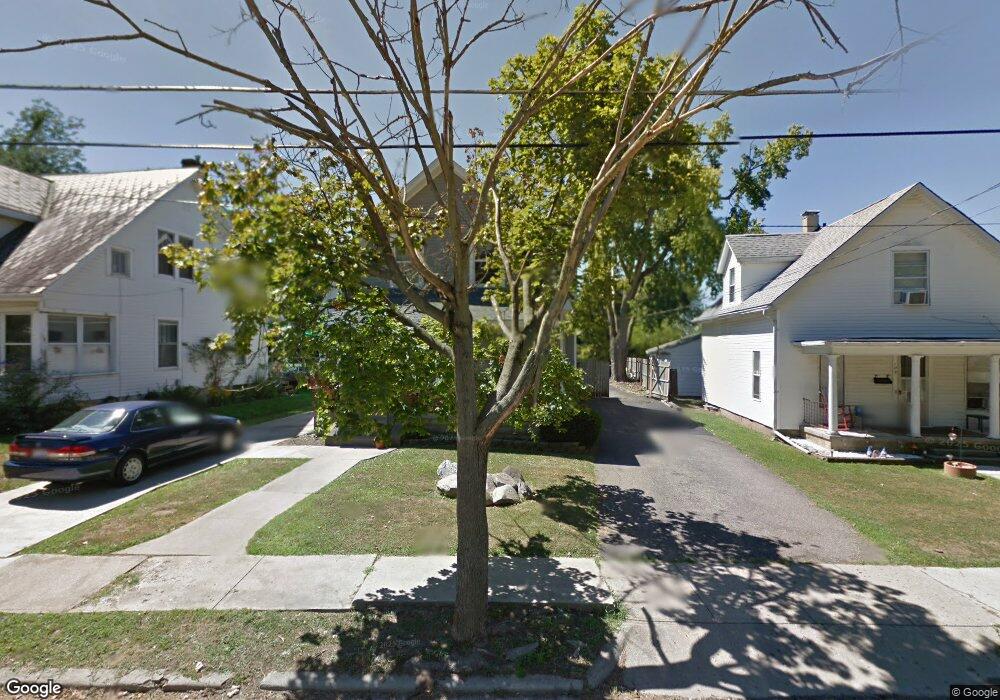
This home is located at 113 Rogers St, Xenia, OH 45385 and is currently estimated at $158,926, approximately $84 per square foot. 113 Rogers St is a home located in Greene County with nearby schools including Xenia High School and Summit Academy Community School for Alternative Learners - Xenia.
Ownership History
Date
Name
Owned For
Owner Type
Purchase Details
Closed on
Nov 9, 2017
Sold by
Hedland Victor A
Bought by
Carman Jerry Keith
Current Estimated Value
Purchase Details
Closed on
Aug 22, 2017
Sold by
Fannie Mae
Bought by
Hedland Victor A
Purchase Details
Closed on
Feb 7, 2003
Sold by
Gorsuch Melissa J and Martin Paul J
Bought by
Eldridge Rozella M and Hoersting John E
Home Financials for this Owner
Home Financials are based on the most recent Mortgage that was taken out on this home.
Original Mortgage
$92,100
Interest Rate
6.01%
Purchase Details
Closed on
Jul 30, 1999
Sold by
Smith Rebecca A and Graham Richard Lee
Bought by
Gorsuch Melissa J
Home Financials for this Owner
Home Financials are based on the most recent Mortgage that was taken out on this home.
Original Mortgage
$88,638
Interest Rate
7.68%
Mortgage Type
VA
Create a Home Valuation Report for This Property
The Home Valuation Report is an in-depth analysis detailing your home's value as well as a comparison with similar homes in the area
Home Values in the Area
Average Home Value in this Area
Purchase History
| Date | Buyer | Sale Price | Title Company |
|---|---|---|---|
| Carman Jerry Keith | -- | -- | |
| Hedland Victor A | -- | Safemark Title | |
| Eldridge Rozella M | $95,000 | -- | |
| Gorsuch Melissa J | $86,900 | -- |
Source: Public Records
Mortgage History
| Date | Status | Borrower | Loan Amount |
|---|---|---|---|
| Previous Owner | Eldridge Rozella M | $92,100 | |
| Previous Owner | Gorsuch Melissa J | $88,638 |
Source: Public Records
Tax History Compared to Growth
Tax History
| Year | Tax Paid | Tax Assessment Tax Assessment Total Assessment is a certain percentage of the fair market value that is determined by local assessors to be the total taxable value of land and additions on the property. | Land | Improvement |
|---|---|---|---|---|
| 2024 | $1,721 | $40,210 | $4,670 | $35,540 |
| 2023 | $1,721 | $40,210 | $4,670 | $35,540 |
| 2022 | $1,518 | $30,250 | $3,730 | $26,520 |
| 2021 | $1,538 | $30,250 | $3,730 | $26,520 |
| 2020 | $1,474 | $30,250 | $3,730 | $26,520 |
| 2019 | $1,403 | $27,110 | $3,970 | $23,140 |
| 2018 | $1,408 | $27,110 | $3,970 | $23,140 |
| 2017 | $1,309 | $27,110 | $3,970 | $23,140 |
| 2016 | $1,309 | $25,410 | $3,970 | $21,440 |
| 2015 | $1,313 | $25,410 | $3,970 | $21,440 |
| 2014 | $1,256 | $25,410 | $3,970 | $21,440 |
Source: Public Records
Map
Nearby Homes