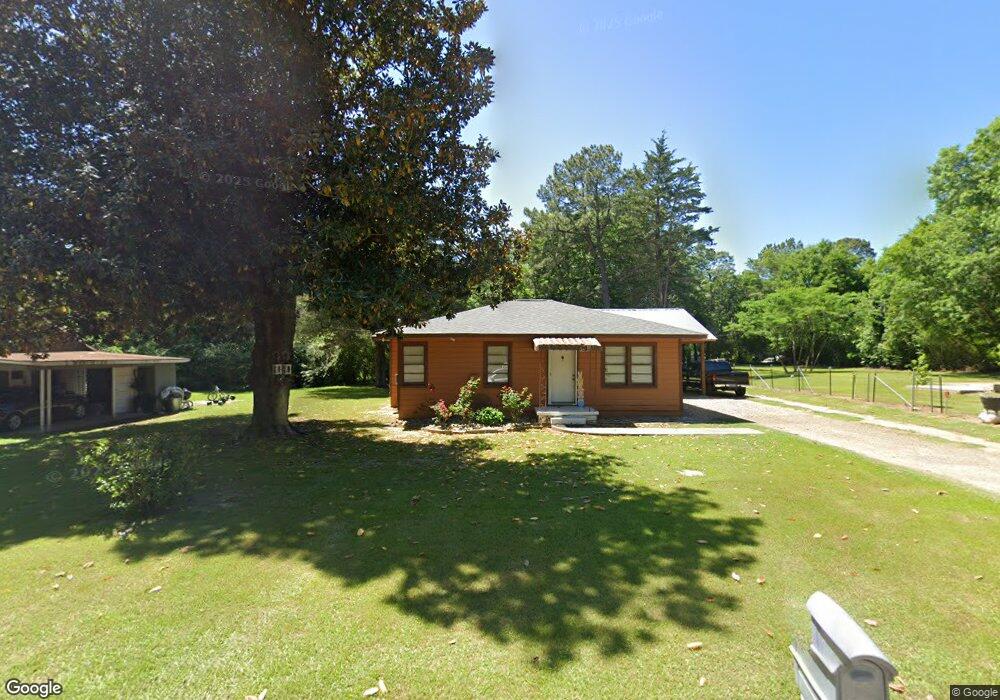
113 Rosewood St Texarkana, TX 75501
Estimated Value: $87,000 - $115,000
--
Bed
--
Bath
1,200
Sq Ft
$84/Sq Ft
Est. Value
About This Home
This home is located at 113 Rosewood St, Texarkana, TX 75501 and is currently estimated at $100,932, approximately $84 per square foot. 113 Rosewood St is a home located in Bowie County with nearby schools including Westlawn Elementary School, Theron Jones Early Literacy Center, and Texas Middle School.
Ownership History
Date
Name
Owned For
Owner Type
Purchase Details
Closed on
Apr 16, 2020
Sold by
Regulo Olvera Real Estate Llc
Bought by
Rosales Jesus O Rosas and Yerbabuena Lesli Florencio
Current Estimated Value
Purchase Details
Closed on
Oct 10, 2008
Sold by
Swartz & Brough Inc
Bought by
Forsyth Brandon and Forsyth La Donna
Home Financials for this Owner
Home Financials are based on the most recent Mortgage that was taken out on this home.
Original Mortgage
$47,250
Interest Rate
6.35%
Purchase Details
Closed on
Dec 17, 2007
Sold by
Swartz & Brough Inc
Bought by
Bradley Sherian
Home Financials for this Owner
Home Financials are based on the most recent Mortgage that was taken out on this home.
Original Mortgage
$40,500
Interest Rate
5.94%
Create a Home Valuation Report for This Property
The Home Valuation Report is an in-depth analysis detailing your home's value as well as a comparison with similar homes in the area
Home Values in the Area
Average Home Value in this Area
Purchase History
| Date | Buyer | Sale Price | Title Company |
|---|---|---|---|
| Rosales Jesus O Rosas | -- | None Available | |
| Rosales Jesus O Rosas | -- | None Available | |
| Forsyth Brandon | -- | None Available | |
| Bradley Sherian | -- | None Available |
Source: Public Records
Mortgage History
| Date | Status | Borrower | Loan Amount |
|---|---|---|---|
| Previous Owner | Forsyth Brandon | $47,250 | |
| Previous Owner | Bradley Sherian | $40,500 |
Source: Public Records
Tax History Compared to Growth
Tax History
| Year | Tax Paid | Tax Assessment Tax Assessment Total Assessment is a certain percentage of the fair market value that is determined by local assessors to be the total taxable value of land and additions on the property. | Land | Improvement |
|---|---|---|---|---|
| 2025 | $563 | $57,418 | -- | -- |
| 2024 | $563 | $52,198 | $10,000 | $64,759 |
| 2023 | $1,124 | $47,453 | $0 | $0 |
| 2022 | $1,030 | $51,908 | $10,000 | $41,908 |
| 2021 | $1,003 | $39,217 | $4,250 | $34,967 |
| 2020 | $967 | $37,608 | $4,250 | $33,358 |
| 2019 | $962 | $36,074 | $4,250 | $31,824 |
| 2018 | $658 | $24,678 | $4,250 | $20,428 |
| 2017 | $646 | $24,292 | $4,250 | $20,042 |
| 2016 | $631 | $23,731 | $4,250 | $19,481 |
| 2015 | $619 | $24,647 | $4,250 | $20,397 |
| 2014 | $619 | $23,934 | $4,250 | $19,684 |
Source: Public Records
Map
Nearby Homes
- 203 Madison Dr
- 1703 Liddell St
- 0 Meadowbrook Ln
- 202 S Kenwood Rd
- 3303 New Boston Rd
- 3106 Meadows Dr
- 826 Redwater Rd
- 2211 N Akin Ave
- 810 Hawkins Ave
- 814 Elaine Dr
- 813 Elaine Dr
- 720 Diane Dr
- 4035 New Boston Rd
- 2901 Marion St
- TBD N Kenwood Rd
- 741 Macarthur Ave
- 500 Wade Ln
- 702 Hawkins Ave
- 0 Belt Rd Unit 118684
- 117 Village Place
- 115 Rosewood St
- 111 Rosewood St
- 111 Rosewood St
- 109 Rosewood St
- 119 Rosewood St
- 110 Rosewood St
- 105 Rosewood St
- 121 Rosewood St
- 104 Rosewood St
- 120 Rosewood St
- 123 Rosewood St
- 822 Westlawn Dr
- 820 Westlawn Dr
- 101 Rosewood St
- 502 S Kenwood Rd
- 524 S Kenwood Rd
- 500 S Kenwood Rd
- S Kenwood Rd
- 420 S Kenwood Rd
- 103 Lilac St