Estimated Value: $580,000 - $606,000
4
Beds
3
Baths
2,179
Sq Ft
$270/Sq Ft
Est. Value
About This Home
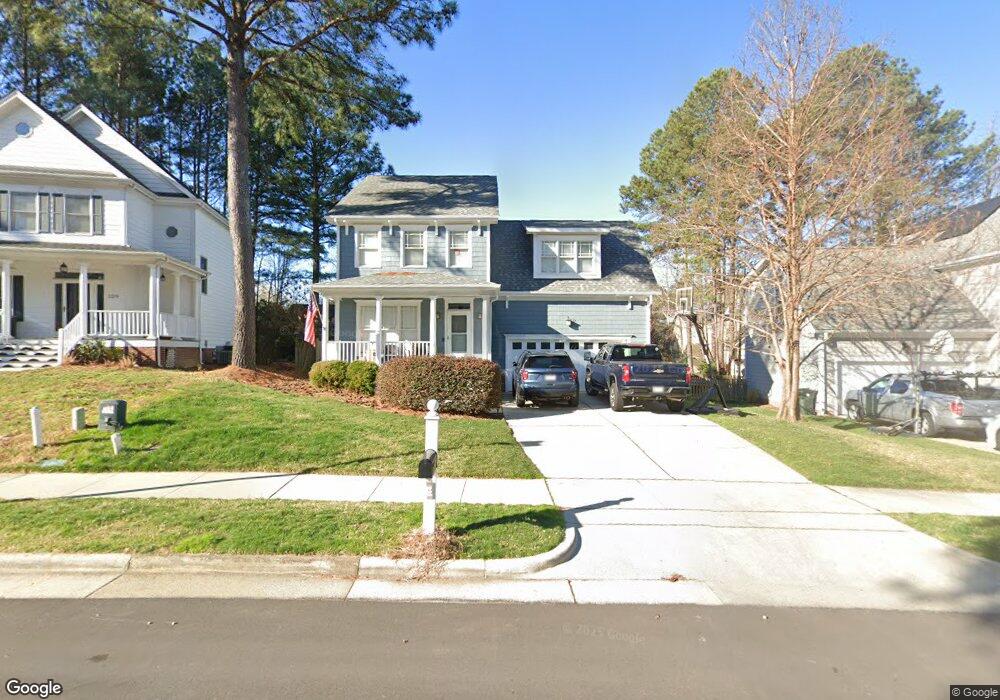
This home is located at 113 Rushing Wind Way, Apex, NC 27502 and is currently estimated at $588,409, approximately $270 per square foot. 113 Rushing Wind Way is a home located in Wake County with nearby schools including Scotts Ridge Elementary School, Apex Middle, and Apex High School.
Ownership History
Date
Name
Owned For
Owner Type
Purchase Details
Closed on
Nov 15, 2017
Sold by
Mills Gregory G and Mills Janet M
Bought by
Zsimmerman Christina Marie and Zsimmerman Troy
Current Estimated Value
Home Financials for this Owner
Home Financials are based on the most recent Mortgage that was taken out on this home.
Original Mortgage
$305,402
Outstanding Balance
$253,508
Interest Rate
3.5%
Mortgage Type
FHA
Estimated Equity
$334,901
Purchase Details
Closed on
Jun 14, 2001
Sold by
Cattano Construction Inc
Bought by
Mills Gregory G and Mills Janet M
Home Financials for this Owner
Home Financials are based on the most recent Mortgage that was taken out on this home.
Original Mortgage
$179,598
Interest Rate
7.06%
Create a Home Valuation Report for This Property
The Home Valuation Report is an in-depth analysis detailing your home's value as well as a comparison with similar homes in the area
Home Values in the Area
Average Home Value in this Area
Purchase History
| Date | Buyer | Sale Price | Title Company |
|---|---|---|---|
| Zsimmerman Christina Marie | $335,000 | None Available | |
| Mills Gregory G | $224,500 | -- |
Source: Public Records
Mortgage History
| Date | Status | Borrower | Loan Amount |
|---|---|---|---|
| Open | Zsimmerman Christina Marie | $305,402 | |
| Previous Owner | Mills Gregory G | $179,598 | |
| Closed | Mills Gregory G | $22,449 |
Source: Public Records
Tax History Compared to Growth
Tax History
| Year | Tax Paid | Tax Assessment Tax Assessment Total Assessment is a certain percentage of the fair market value that is determined by local assessors to be the total taxable value of land and additions on the property. | Land | Improvement |
|---|---|---|---|---|
| 2025 | $4,885 | $557,203 | $180,000 | $377,203 |
| 2024 | $4,776 | $557,203 | $180,000 | $377,203 |
| 2023 | $3,881 | $351,948 | $80,000 | $271,948 |
| 2022 | $3,643 | $351,948 | $80,000 | $271,948 |
| 2021 | $3,504 | $351,948 | $80,000 | $271,948 |
| 2020 | $3,469 | $351,948 | $80,000 | $271,948 |
| 2019 | $3,374 | $295,354 | $80,000 | $215,354 |
| 2018 | $3,179 | $295,354 | $80,000 | $215,354 |
| 2017 | $2,959 | $295,354 | $80,000 | $215,354 |
| 2016 | $2,916 | $295,354 | $80,000 | $215,354 |
| 2015 | $2,827 | $279,394 | $62,000 | $217,394 |
| 2014 | -- | $279,394 | $62,000 | $217,394 |
Source: Public Records
Map
Nearby Homes
- 1131 Bungalow Park Dr
- 104 Pine Tag Ct
- 1042 Mica Lamp Ct
- 428 Heritage Village Ln
- 1773 Town Home Dr
- 441 Heritage Village Ln
- 448 Heritage Village Ln
- 460 Heritage Village Ln
- 402 Village Loop Dr
- 1910 Woodall Crest Dr
- 1701 Barrett Run Trail
- 2129 Kelly Rd
- 1706 Patterson Grove Rd
- 1880 Woodall Crest Dr
- 541 Village Loop Dr
- 1726 Barrett Run Trail
- 1844 Woodall Crest Dr
- 3014 Silky Dogwood Trail
- 1811 Aspen River Ln
- 1809 Barrett Run Trail
- 109 Rushing Wind Way
- 117 Rushing Wind Way
- 1009 Scotts Ridge Trail
- 1011 Scotts Ridge Trail
- 105 Rushing Wind Way
- 121 Rushing Wind Way
- 1007 Scotts Ridge Trail
- 1013 Scotts Ridge Trail
- 114 Rushing Wind Way
- 110 Rushing Wind Way
- 1005 Scotts Ridge Trail
- 118 Rushing Wind Way
- 1015 Scotts Ridge Trail
- 104 Rushing Wind Way
- 107 Forestcrest Ct
- 105 Forestcrest Ct
- 1003 Scotts Ridge Trail
- 100 Rushing Wind Way
- 201 Rushing Wind Way
- 101 Forestcrest Ct