Estimated Value: $390,000 - $445,000
3
Beds
2
Baths
1,836
Sq Ft
$224/Sq Ft
Est. Value
About This Home
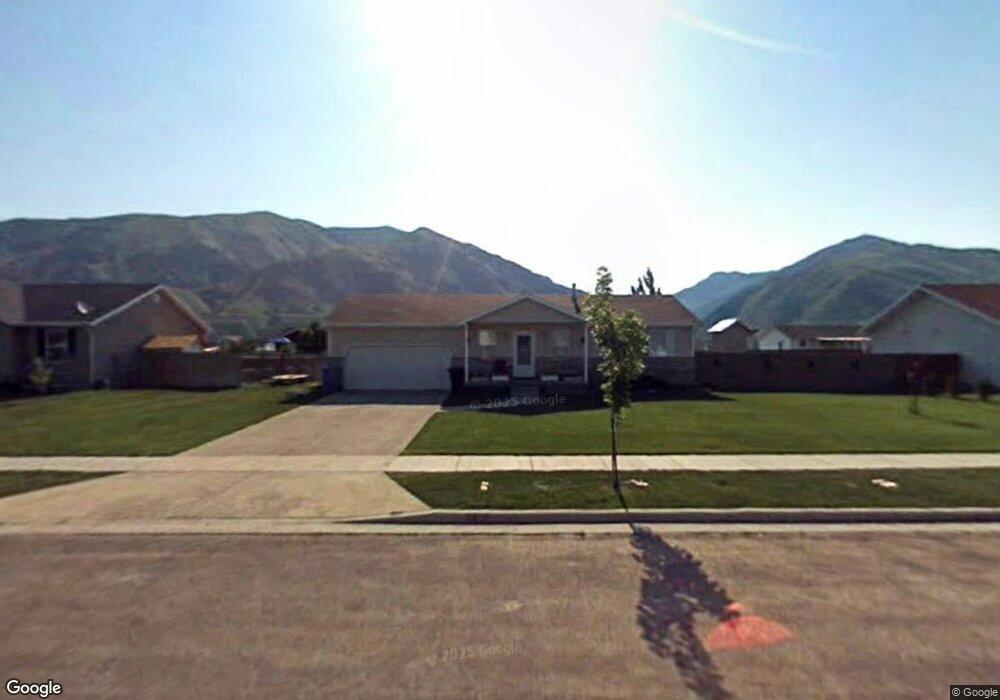
This home is located at 113 S 1250 E, Hyrum, UT 84319 and is currently estimated at $411,462, approximately $224 per square foot. 113 S 1250 E is a home located in Cache County with nearby schools including Canyon School, South Cache Middle School, and Mountain Crest High School.
Ownership History
Date
Name
Owned For
Owner Type
Purchase Details
Closed on
Sep 13, 2019
Sold by
Hansen Amanda
Bought by
Bennett Steven R and Bennett Sarah E
Current Estimated Value
Home Financials for this Owner
Home Financials are based on the most recent Mortgage that was taken out on this home.
Original Mortgage
$230,303
Outstanding Balance
$201,703
Interest Rate
3.7%
Mortgage Type
USDA
Estimated Equity
$209,759
Purchase Details
Closed on
Apr 16, 2012
Sold by
Hansen Brent Dean
Bought by
Hansen Amanda
Purchase Details
Closed on
Jul 7, 2005
Sold by
Spillman Technologies Inc
Bought by
Hansen Brent Dean and Hansen Amanda
Home Financials for this Owner
Home Financials are based on the most recent Mortgage that was taken out on this home.
Original Mortgage
$128,877
Interest Rate
5.58%
Mortgage Type
FHA
Create a Home Valuation Report for This Property
The Home Valuation Report is an in-depth analysis detailing your home's value as well as a comparison with similar homes in the area
Home Values in the Area
Average Home Value in this Area
Purchase History
| Date | Buyer | Sale Price | Title Company |
|---|---|---|---|
| Bennett Steven R | -- | Cache Title Logan | |
| Hansen Amanda | -- | None Available | |
| Hansen Brent Dean | -- | Cache Title Company | |
| Spillman Technologies Inc | -- | Cache Title Company |
Source: Public Records
Mortgage History
| Date | Status | Borrower | Loan Amount |
|---|---|---|---|
| Open | Bennett Steven R | $230,303 | |
| Previous Owner | Hansen Brent Dean | $128,877 |
Source: Public Records
Tax History
| Year | Tax Paid | Tax Assessment Tax Assessment Total Assessment is a certain percentage of the fair market value that is determined by local assessors to be the total taxable value of land and additions on the property. | Land | Improvement |
|---|---|---|---|---|
| 2025 | $148 | $213,195 | $0 | $0 |
| 2024 | $1,582 | $212,120 | $0 | $0 |
| 2023 | $1,742 | $223,295 | $0 | $0 |
| 2022 | $1,818 | $223,295 | $0 | $0 |
| 2021 | $1,784 | $337,790 | $65,000 | $272,790 |
| 2020 | $1,342 | $238,431 | $65,000 | $173,431 |
| 2019 | $1,278 | $213,431 | $40,000 | $173,431 |
| 2018 | $1,181 | $190,810 | $40,000 | $150,810 |
| 2017 | $1,162 | $97,405 | $0 | $0 |
| 2016 | $1,188 | $84,535 | $0 | $0 |
| 2015 | $963 | $78,735 | $0 | $0 |
| 2014 | $942 | $78,735 | $0 | $0 |
| 2013 | -- | $78,735 | $0 | $0 |
Source: Public Records
Map
Nearby Homes
Your Personal Tour Guide
Ask me questions while you tour the home.