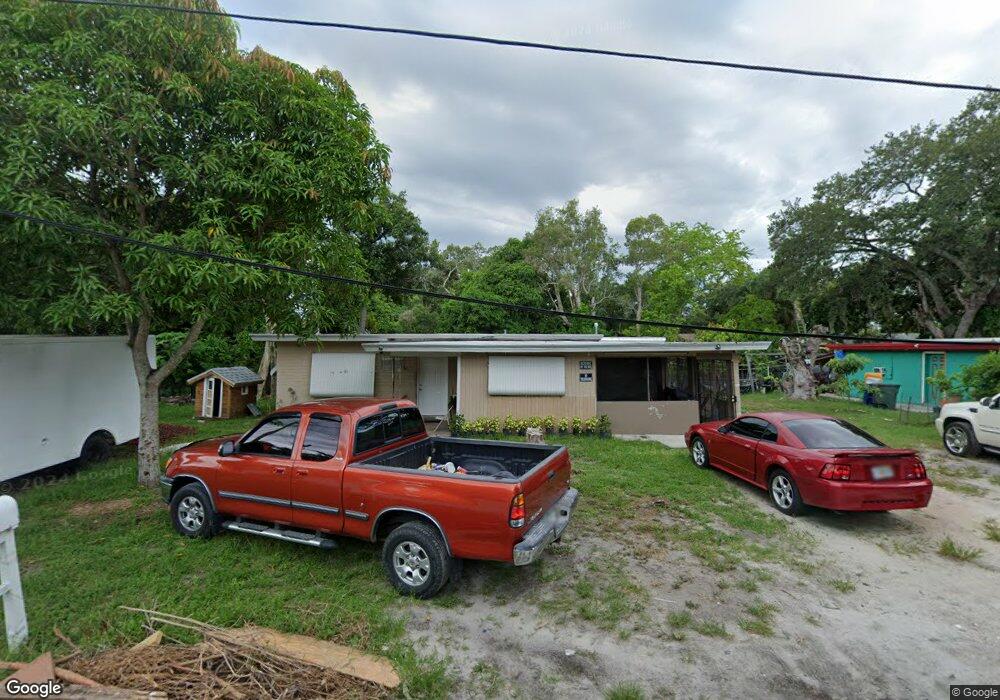
113 S 16th St Fort Pierce, FL 34950
Estimated Value: $185,025 - $238,000
2
Beds
1
Bath
1,118
Sq Ft
$179/Sq Ft
Est. Value
About This Home
This home is located at 113 S 16th St, Fort Pierce, FL 34950 and is currently estimated at $200,256, approximately $179 per square foot. 113 S 16th St is a home located in St. Lucie County with nearby schools including Chester A. Moore Elementary School, Lawnwood Elementary School, and St. Lucie Elementary School.
Ownership History
Date
Name
Owned For
Owner Type
Purchase Details
Closed on
Mar 2, 2015
Sold by
Starling Bonnie L
Bought by
Arredondo Marisol
Current Estimated Value
Purchase Details
Closed on
Jul 27, 1999
Sold by
Clerk Circuit Court
Bought by
Adler Marjorie
Purchase Details
Closed on
Nov 25, 1997
Sold by
Swartz Sylvia and Donaldson Eula
Bought by
Rivas Vicki L
Home Financials for this Owner
Home Financials are based on the most recent Mortgage that was taken out on this home.
Original Mortgage
$13,000
Interest Rate
7.35%
Create a Home Valuation Report for This Property
The Home Valuation Report is an in-depth analysis detailing your home's value as well as a comparison with similar homes in the area
Home Values in the Area
Average Home Value in this Area
Purchase History
| Date | Buyer | Sale Price | Title Company |
|---|---|---|---|
| Arredondo Marisol | $20,000 | St Lucie Title Services Inc | |
| Adler Marjorie | -- | -- | |
| Rivas Vicki L | $13,000 | -- |
Source: Public Records
Mortgage History
| Date | Status | Borrower | Loan Amount |
|---|---|---|---|
| Previous Owner | Rivas Vicki L | $13,000 |
Source: Public Records
Tax History Compared to Growth
Tax History
| Year | Tax Paid | Tax Assessment Tax Assessment Total Assessment is a certain percentage of the fair market value that is determined by local assessors to be the total taxable value of land and additions on the property. | Land | Improvement |
|---|---|---|---|---|
| 2024 | $3,463 | $136,100 | $60,700 | $75,400 |
| 2023 | $3,463 | $138,900 | $63,800 | $75,100 |
| 2022 | $303 | $34,499 | $0 | $0 |
| 2021 | $284 | $33,495 | $0 | $0 |
| 2020 | $276 | $33,033 | $0 | $0 |
| 2019 | $259 | $32,291 | $0 | $0 |
| 2018 | $223 | $31,689 | $0 | $0 |
| 2017 | $208 | $31,800 | $6,600 | $25,200 |
| 2016 | $193 | $30,400 | $6,300 | $24,100 |
| 2015 | $713 | $25,200 | $5,300 | $19,900 |
| 2014 | $681 | $24,600 | $0 | $0 |
Source: Public Records
Map
Nearby Homes