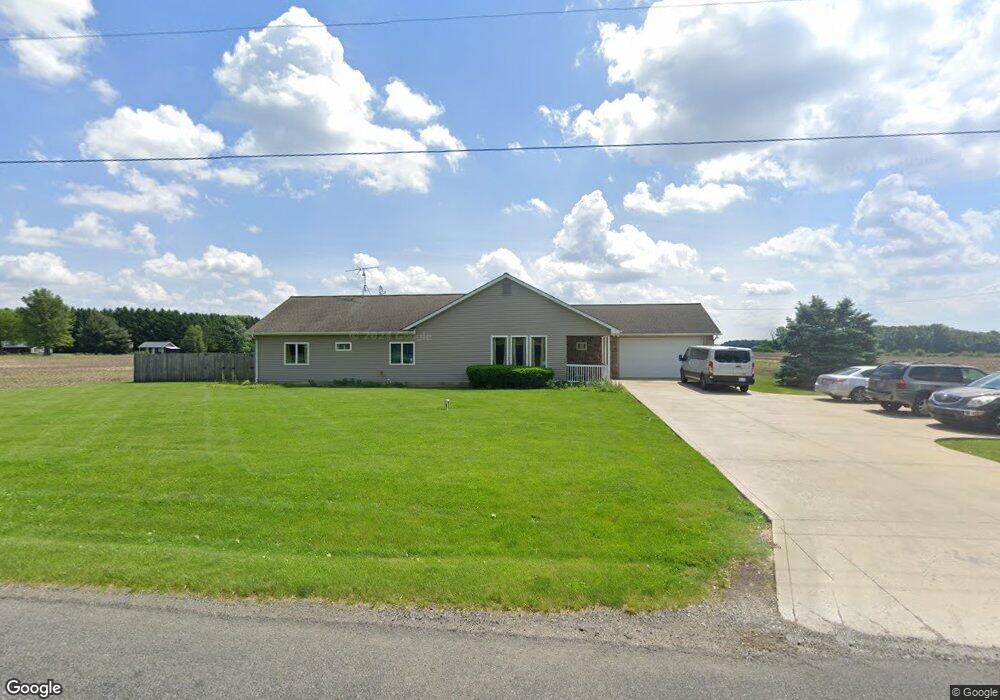
113 S 325 E Valparaiso, IN 46383
Porter County NeighborhoodEstimated Value: $487,333 - $578,000
4
Beds
3
Baths
2,730
Sq Ft
$197/Sq Ft
Est. Value
About This Home
This home is located at 113 S 325 E, Valparaiso, IN 46383 and is currently estimated at $538,583, approximately $197 per square foot. 113 S 325 E is a home located in Porter County with nearby schools including Morgan Township Elementary School and Morgan Township Middle/High School.
Ownership History
Date
Name
Owned For
Owner Type
Purchase Details
Closed on
Dec 19, 2013
Sold by
Orp Real Estate Holdings Llc
Bought by
Eclipse Investments Llc
Current Estimated Value
Home Financials for this Owner
Home Financials are based on the most recent Mortgage that was taken out on this home.
Original Mortgage
$1,625,000
Outstanding Balance
$1,210,058
Interest Rate
4.5%
Mortgage Type
Purchase Money Mortgage
Estimated Equity
-$671,475
Purchase Details
Closed on
Mar 7, 2008
Sold by
Leslie Ellen K
Bought by
Leslie Property & Development Llc
Create a Home Valuation Report for This Property
The Home Valuation Report is an in-depth analysis detailing your home's value as well as a comparison with similar homes in the area
Home Values in the Area
Average Home Value in this Area
Purchase History
| Date | Buyer | Sale Price | Title Company |
|---|---|---|---|
| Eclipse Investments Llc | -- | Ctic | |
| Leslie Property & Development Llc | -- | None Available |
Source: Public Records
Mortgage History
| Date | Status | Borrower | Loan Amount |
|---|---|---|---|
| Open | Eclipse Investments Llc | $1,625,000 |
Source: Public Records
Tax History
| Year | Tax Paid | Tax Assessment Tax Assessment Total Assessment is a certain percentage of the fair market value that is determined by local assessors to be the total taxable value of land and additions on the property. | Land | Improvement |
|---|---|---|---|---|
| 2025 | $6,239 | $433,800 | $67,500 | $366,300 |
| 2024 | $5,999 | $461,200 | $40,700 | $420,500 |
| 2023 | $5,448 | $416,200 | $35,800 | $380,400 |
| 2022 | $5,308 | $375,700 | $35,800 | $339,900 |
| 2021 | $5,044 | $331,700 | $35,800 | $295,900 |
| 2020 | $4,649 | $302,300 | $31,100 | $271,200 |
| 2019 | $4,524 | $284,000 | $31,100 | $252,900 |
| 2018 | $4,240 | $272,500 | $31,100 | $241,400 |
| 2017 | $4,284 | $272,300 | $31,100 | $241,200 |
| 2016 | $3,808 | $256,100 | $31,800 | $224,300 |
| 2014 | $4,032 | $251,200 | $30,800 | $220,400 |
| 2013 | -- | $238,600 | $31,100 | $207,500 |
Source: Public Records
Map
Nearby Homes
- 323 E 124 S
- 421 Amy Rose Ln
- 430 Oak Breeze Dr
- 0 Parcel A 325 E
- 0 Parcel B 325 E
- 168 Jamestown Ave
- 87 Kaper Ln
- 3906 Murvihill Rd
- 3253 Mockingbird Ln
- 3252 Mockingbird Ln
- 0 Porters Vale Blvd Unit GNR544918
- 0 St Road 2 Unit GNR544911
- 1257 Cr-325 E
- 2651 Woodbine Dr
- 48 E Division Rd
- 6775 E 103rd Ln
- 0 Silhavy Rd
- 0 Smoke Rd
- 2208 Stori Ln
- 374 Glenallyn Dr
Your Personal Tour Guide
Ask me questions while you tour the home.