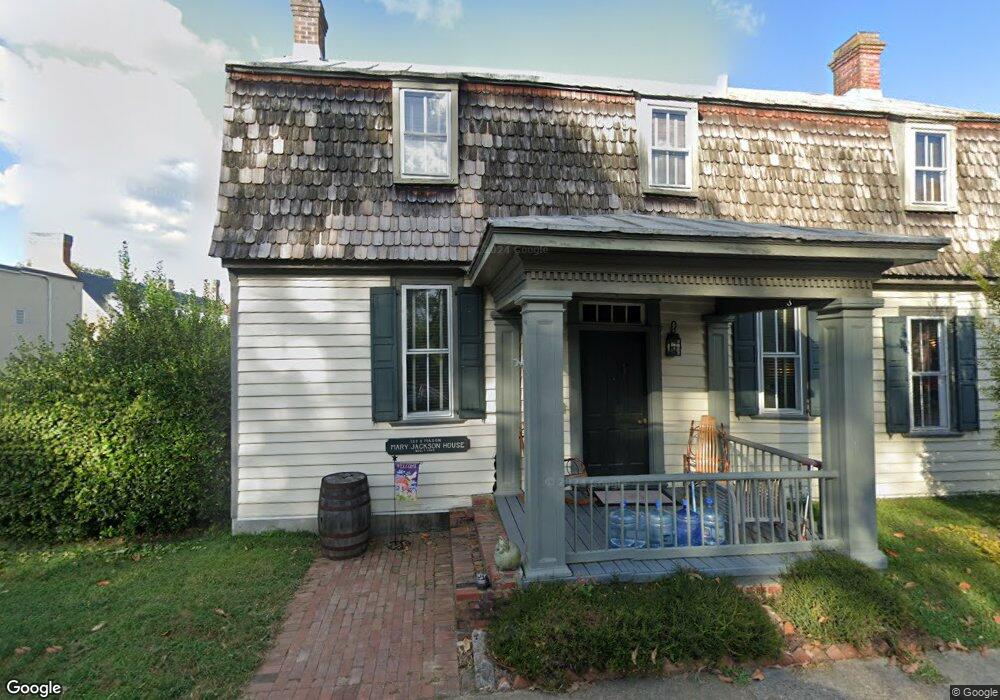
113 S Mason St Smithfield, VA 23430
Estimated Value: $388,087 - $479,000
3
Beds
3
Baths
2,212
Sq Ft
$193/Sq Ft
Est. Value
About This Home
This home is located at 113 S Mason St, Smithfield, VA 23430 and is currently estimated at $427,772, approximately $193 per square foot. 113 S Mason St is a home located in Isle of Wight County with nearby schools including Hardy Elementary School, Smithfield Middle School, and Smithfield High School.
Ownership History
Date
Name
Owned For
Owner Type
Purchase Details
Closed on
Jul 19, 2023
Sold by
Mcgiboney Dale C and Mcgiboney Sonja E
Bought by
Degraaff Rens J and De Graaff Katie
Current Estimated Value
Home Financials for this Owner
Home Financials are based on the most recent Mortgage that was taken out on this home.
Original Mortgage
$272,000
Outstanding Balance
$265,415
Interest Rate
6.71%
Mortgage Type
New Conventional
Estimated Equity
$162,357
Purchase Details
Closed on
Jan 29, 2016
Purchase Details
Closed on
Aug 1, 2008
Sold by
Canter Bryan E
Purchase Details
Closed on
May 20, 2003
Purchase Details
Closed on
Dec 12, 1996
Create a Home Valuation Report for This Property
The Home Valuation Report is an in-depth analysis detailing your home's value as well as a comparison with similar homes in the area
Home Values in the Area
Average Home Value in this Area
Purchase History
| Date | Buyer | Sale Price | Title Company |
|---|---|---|---|
| Degraaff Rens J | $340,000 | Fidelity National Title | |
| -- | $244,900 | -- | |
| -- | -- | -- | |
| -- | $190,000 | -- | |
| -- | $129,000 | -- |
Source: Public Records
Mortgage History
| Date | Status | Borrower | Loan Amount |
|---|---|---|---|
| Open | Degraaff Rens J | $272,000 |
Source: Public Records
Tax History
| Year | Tax Paid | Tax Assessment Tax Assessment Total Assessment is a certain percentage of the fair market value that is determined by local assessors to be the total taxable value of land and additions on the property. | Land | Improvement |
|---|---|---|---|---|
| 2025 | $2,677 | $345,400 | $80,000 | $265,400 |
| 2024 | $2,521 | $345,400 | $80,000 | $265,400 |
| 2023 | $2,506 | $345,400 | $80,000 | $265,400 |
| 2022 | $2,188 | $251,100 | $80,000 | $171,100 |
| 2021 | $2,188 | $251,100 | $80,000 | $171,100 |
| 2020 | $2,188 | $251,100 | $80,000 | $171,100 |
| 2019 | $2,188 | $251,100 | $80,000 | $171,100 |
| 2018 | $2,148 | $246,400 | $80,000 | $166,400 |
| 2016 | $2,166 | $246,400 | $80,000 | $166,400 |
| 2015 | $2,119 | $246,400 | $80,000 | $166,400 |
| 2014 | $2,119 | $240,800 | $80,000 | $160,800 |
| 2013 | -- | $240,800 | $80,000 | $160,800 |
Source: Public Records
Map
Nearby Homes
Your Personal Tour Guide
Ask me questions while you tour the home.