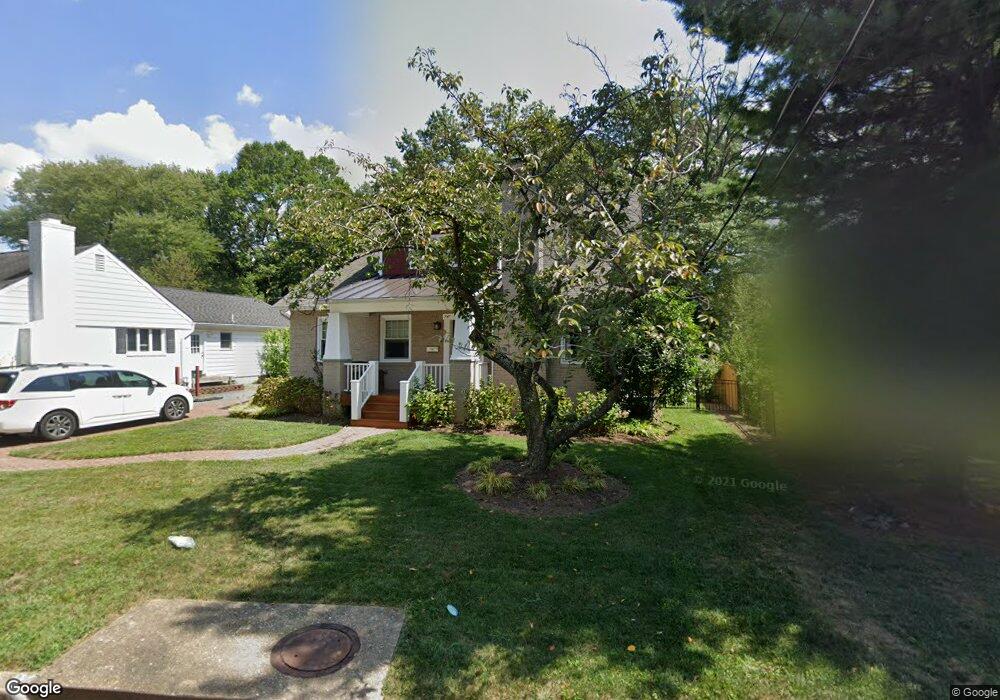
113 S Spring St Falls Church, VA 22046
Estimated Value: $1,445,000 - $1,871,000
3
Beds
1
Bath
2,668
Sq Ft
$595/Sq Ft
Est. Value
About This Home
This home is located at 113 S Spring St, Falls Church, VA 22046 and is currently estimated at $1,586,360, approximately $594 per square foot. 113 S Spring St is a home located in Falls Church City with nearby schools including Mt. Daniel Elementary School, Mary Ellen Henderson Middle School, and Meridian High School.
Ownership History
Date
Name
Owned For
Owner Type
Purchase Details
Closed on
Aug 16, 2010
Sold by
Epp Nathaniel
Bought by
Chuhay Daniel
Current Estimated Value
Home Financials for this Owner
Home Financials are based on the most recent Mortgage that was taken out on this home.
Original Mortgage
$549,598
Outstanding Balance
$357,970
Interest Rate
4.25%
Mortgage Type
FHA
Estimated Equity
$1,228,390
Purchase Details
Closed on
Jul 14, 2005
Sold by
Marble Christy
Bought by
Vanepp Nathaniel
Home Financials for this Owner
Home Financials are based on the most recent Mortgage that was taken out on this home.
Original Mortgage
$440,000
Interest Rate
5.67%
Mortgage Type
New Conventional
Purchase Details
Closed on
Jun 20, 2002
Sold by
Seidel Mark
Bought by
Marble Christy
Home Financials for this Owner
Home Financials are based on the most recent Mortgage that was taken out on this home.
Original Mortgage
$264,000
Interest Rate
6.81%
Mortgage Type
New Conventional
Purchase Details
Closed on
Nov 15, 1993
Sold by
Miller D H
Bought by
Seidel Mark J
Home Financials for this Owner
Home Financials are based on the most recent Mortgage that was taken out on this home.
Original Mortgage
$160,500
Interest Rate
6.79%
Create a Home Valuation Report for This Property
The Home Valuation Report is an in-depth analysis detailing your home's value as well as a comparison with similar homes in the area
Home Values in the Area
Average Home Value in this Area
Purchase History
| Date | Buyer | Sale Price | Title Company |
|---|---|---|---|
| Chuhay Daniel | $557,000 | -- | |
| Vanepp Nathaniel | $550,000 | -- | |
| Marble Christy | $330,000 | -- | |
| Seidel Mark J | $169,000 | -- |
Source: Public Records
Mortgage History
| Date | Status | Borrower | Loan Amount |
|---|---|---|---|
| Open | Chuhay Daniel | $549,598 | |
| Previous Owner | Vanepp Nathaniel | $440,000 | |
| Previous Owner | Marble Christy | $264,000 | |
| Previous Owner | Seidel Mark J | $160,500 |
Source: Public Records
Tax History Compared to Growth
Tax History
| Year | Tax Paid | Tax Assessment Tax Assessment Total Assessment is a certain percentage of the fair market value that is determined by local assessors to be the total taxable value of land and additions on the property. | Land | Improvement |
|---|---|---|---|---|
| 2025 | $15,409 | $1,383,400 | $694,000 | $689,400 |
| 2024 | $15,409 | $1,252,800 | $648,600 | $604,200 |
| 2023 | $14,585 | $1,185,800 | $563,900 | $621,900 |
| 2022 | $14,146 | $1,083,000 | $563,900 | $519,100 |
| 2021 | $14,352 | $1,071,700 | $525,000 | $546,700 |
| 2020 | $14,032 | $1,020,700 | $500,000 | $520,700 |
| 2019 | $13,728 | $998,200 | $477,500 | $520,700 |
| 2018 | $12,048 | $987,600 | $466,900 | $520,700 |
| 2017 | $10,576 | $784,400 | $452,000 | $332,400 |
| 2016 | $5,256 | $784,400 | $452,000 | $332,400 |
| 2015 | $10,513 | $784,400 | $452,000 | $332,400 |
| 2014 | $9,855 | $740,000 | $426,400 | $313,600 |
Source: Public Records
Map
Nearby Homes
- 727 Park Ave
- 140 N Oak St
- 721 Park Ave
- 677 Park Ave
- 502 W Broad St Unit 501
- 502 W Broad St Unit 215
- 513 W Broad St Unit 702
- 513 W Broad St Unit 510
- 150 N Lee St
- 154 N Lee St
- 156 N Lee St
- 812 Fulton Ave
- 444 W Broad St Unit 617
- 444 W Broad St Unit 401
- 209 S Virginia Ave
- 1022 Railroad Ave Unit 4
- 1200 Offutt Dr
- 601 Timber Ln
- 304 Rollins St
- 411 S Virginia Ave
- 115 S Spring St
- 111 S Spring St
- 117 S Spring St
- 109 S Spring St
- 119 S Spring St
- 107 S Spring St
- 109 Hillier St
- 121 S Spring St
- 112 S Spring St
- 110 S Spring St
- 116 S Spring St
- 108 S Spring St
- 118 S Spring St
- 107 Hillier St
- 123 S Spring St
- 106 S Spring St
- 120 S Spring St
- 104 S Spring St
- 122 S Spring St
- 809 W Broad St