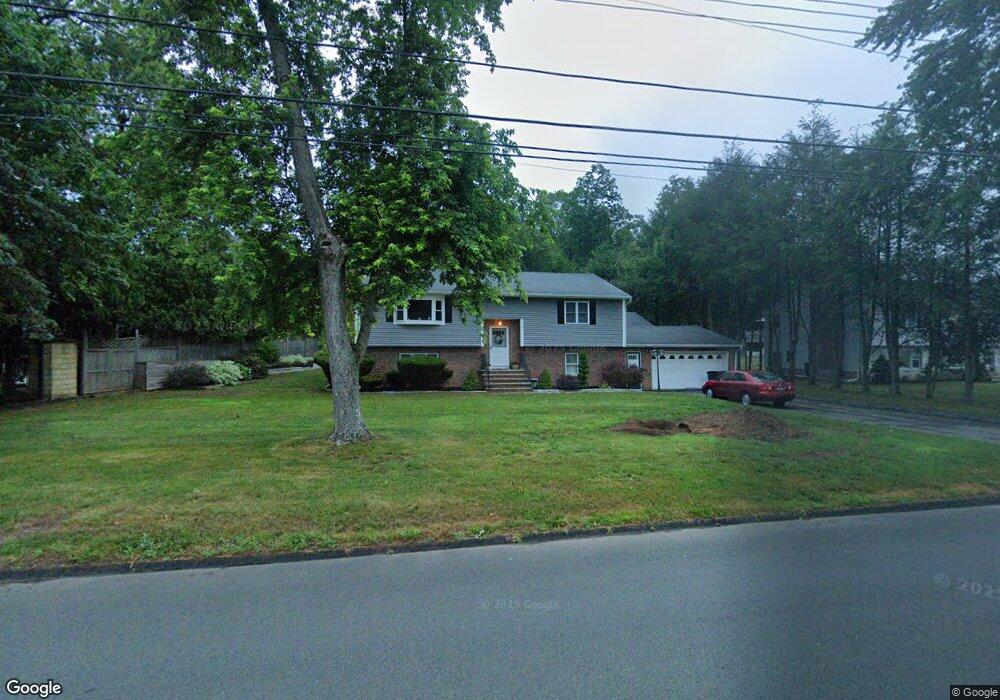
113 Scrub Oak Rd North Haven, CT 06473
Estimated Value: $412,000 - $483,049
3
Beds
2
Baths
1,246
Sq Ft
$358/Sq Ft
Est. Value
About This Home
This home is located at 113 Scrub Oak Rd, North Haven, CT 06473 and is currently estimated at $446,012, approximately $357 per square foot. 113 Scrub Oak Rd is a home located in New Haven County with nearby schools including North Haven High School and Heritage Baptist Academy.
Ownership History
Date
Name
Owned For
Owner Type
Purchase Details
Closed on
Feb 13, 2020
Sold by
Derrico Florence
Bought by
Derrico Nicholas
Current Estimated Value
Purchase Details
Closed on
Feb 12, 2020
Sold by
Derrico Jennifer A
Bought by
Derrico Florence
Purchase Details
Closed on
Sep 12, 2018
Sold by
Derrico Florence and Derrico Nicholas
Bought by
Derrico 4Th Nicholas and Derrico Jennifer A
Purchase Details
Closed on
Aug 9, 2002
Sold by
Stanwich Holly A
Bought by
Lee Michelle L
Purchase Details
Closed on
Nov 16, 2000
Sold by
Martin Barbara A
Bought by
Stanwich Holly A
Home Financials for this Owner
Home Financials are based on the most recent Mortgage that was taken out on this home.
Original Mortgage
$112,000
Interest Rate
8.63%
Create a Home Valuation Report for This Property
The Home Valuation Report is an in-depth analysis detailing your home's value as well as a comparison with similar homes in the area
Home Values in the Area
Average Home Value in this Area
Purchase History
| Date | Buyer | Sale Price | Title Company |
|---|---|---|---|
| Derrico Nicholas | -- | None Available | |
| Derrico Florence | -- | None Available | |
| Derrico 4Th Nicholas | -- | -- | |
| Lee Michelle L | $25,000 | -- | |
| Stanwich Holly A | $10,000 | -- |
Source: Public Records
Mortgage History
| Date | Status | Borrower | Loan Amount |
|---|---|---|---|
| Previous Owner | Stanwich Holly A | $25,000 | |
| Previous Owner | Stanwich Holly A | $112,000 | |
| Previous Owner | Stanwich Holly A | $47,000 |
Source: Public Records
Tax History Compared to Growth
Tax History
| Year | Tax Paid | Tax Assessment Tax Assessment Total Assessment is a certain percentage of the fair market value that is determined by local assessors to be the total taxable value of land and additions on the property. | Land | Improvement |
|---|---|---|---|---|
| 2025 | $9,065 | $307,720 | $76,300 | $231,420 |
| 2024 | $7,977 | $230,290 | $76,300 | $153,990 |
| 2023 | $7,519 | $230,290 | $76,300 | $153,990 |
| 2022 | $7,072 | $230,290 | $76,300 | $153,990 |
| 2021 | $0 | $230,290 | $76,300 | $153,990 |
| 2020 | $6,404 | $230,290 | $76,300 | $153,990 |
| 2019 | $6,550 | $210,070 | $72,240 | $137,830 |
| 2018 | $6,284 | $210,070 | $72,240 | $137,830 |
| 2017 | $6,349 | $207,620 | $72,240 | $135,380 |
| 2016 | $6,339 | $207,620 | $72,240 | $135,380 |
| 2015 | $6,108 | $207,620 | $72,240 | $135,380 |
| 2014 | $6,074 | $216,160 | $83,300 | $132,860 |
Source: Public Records
Map
Nearby Homes
- 14 Saint Andrews Cir Unit 6
- 32 Brian Rd
- 7 Cypress Ln Unit 3
- 3 Pilgrim Harbor Unit C
- 10 Pilgrim Harbor Unit D
- 3 Pilgrim Harbor Unit A
- 6 Cypress Ln Unit 2
- 513 Pilgrim Harbor
- 100-150 Dodge Ave
- 12 Roxbury Ln
- 26 Mallard Ct
- 91 Pond Hill Rd
- 120 Grandview Ave
- 11 Musket Dr
- 333 S Elm St
- 1450 Mount Carmel Ave
- 341 Long Hill Rd
- 1350 Mount Carmel Ave
- 36R Nod Brook Rd
- 129 Brentwood Dr
- 115 Scrub Oak Rd
- 117 Scrub Oak Rd
- 110 Scrub Oak Rd
- 112 Scrub Oak Rd
- 106 Scrub Oak Rd
- 114 Scrub Oak Rd
- 104 Scrub Oak Rd
- 119 Scrub Oak Rd
- 5 Evergreen Place
- 102 Scrub Oak Rd
- 6 Evergreen Place
- 123 Scrub Oak Rd
- 119 Bradley St
- 125 Bradley St
- 100 Scrub Oak Rd
- 9 Evergreen Place
- 113 Bradley St
- 118 Scrub Oak Rd
- 10 Evergreen Place
- 98 Scrub Oak Rd