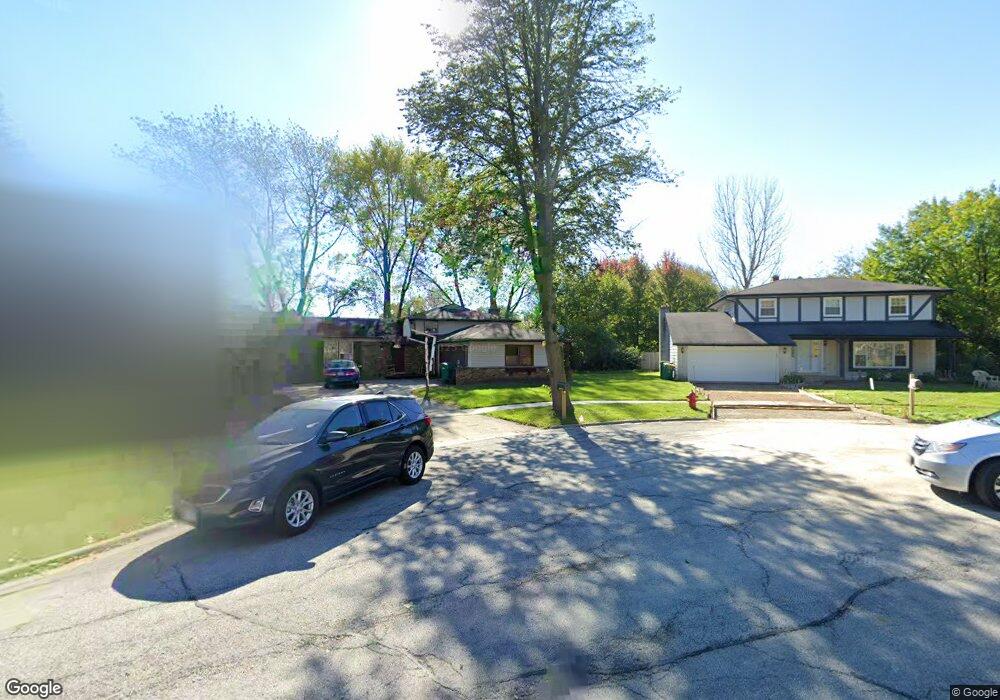
113 Selwyn Ln Buffalo Grove, IL 60089
South Buffalo Grove NeighborhoodEstimated Value: $446,000 - $452,000
3
Beds
2
Baths
1,362
Sq Ft
$330/Sq Ft
Est. Value
About This Home
This home is located at 113 Selwyn Ln, Buffalo Grove, IL 60089 and is currently estimated at $449,360, approximately $329 per square foot. 113 Selwyn Ln is a home located in Cook County with nearby schools including Booth Tarkington Elementary School, Jack London Middle School, and Wheeling High School.
Ownership History
Date
Name
Owned For
Owner Type
Purchase Details
Closed on
Aug 21, 2003
Sold by
Svigos John and Svigos Michael
Bought by
C D Kasson Esq
Current Estimated Value
Home Financials for this Owner
Home Financials are based on the most recent Mortgage that was taken out on this home.
Original Mortgage
$100,000
Interest Rate
5.37%
Mortgage Type
Seller Take Back
Purchase Details
Closed on
Jul 3, 2003
Sold by
Karabetsos Tom and Karabetsos Catherine
Bought by
Martinez Felix Ocampo
Home Financials for this Owner
Home Financials are based on the most recent Mortgage that was taken out on this home.
Original Mortgage
$100,000
Interest Rate
5.37%
Mortgage Type
Seller Take Back
Purchase Details
Closed on
Oct 31, 1994
Sold by
Volpyansky Alla
Bought by
Karabetsos Tom and Karabetsos Catherine C
Home Financials for this Owner
Home Financials are based on the most recent Mortgage that was taken out on this home.
Original Mortgage
$157,905
Interest Rate
6.25%
Purchase Details
Closed on
Oct 12, 1993
Sold by
Volpyansky Ilya and Volpyansky Alla
Bought by
Volpyansky Alla
Create a Home Valuation Report for This Property
The Home Valuation Report is an in-depth analysis detailing your home's value as well as a comparison with similar homes in the area
Home Values in the Area
Average Home Value in this Area
Purchase History
| Date | Buyer | Sale Price | Title Company |
|---|---|---|---|
| C D Kasson Esq | $35,000 | -- | |
| Martinez Felix Ocampo | $330,000 | -- | |
| Karabetsos Tom | $175,500 | Heritage Title Co | |
| Volpyansky Alla | -- | -- |
Source: Public Records
Mortgage History
| Date | Status | Borrower | Loan Amount |
|---|---|---|---|
| Previous Owner | Martinez Felix Ocampo | $100,000 | |
| Previous Owner | Karabetsos Tom | $157,905 |
Source: Public Records
Tax History Compared to Growth
Tax History
| Year | Tax Paid | Tax Assessment Tax Assessment Total Assessment is a certain percentage of the fair market value that is determined by local assessors to be the total taxable value of land and additions on the property. | Land | Improvement |
|---|---|---|---|---|
| 2024 | $8,673 | $30,000 | $6,130 | $23,870 |
| 2023 | $8,274 | $30,000 | $6,130 | $23,870 |
| 2022 | $8,274 | $30,000 | $6,130 | $23,870 |
| 2021 | $9,099 | $28,697 | $3,916 | $24,781 |
| 2020 | $8,941 | $28,697 | $3,916 | $24,781 |
| 2019 | $8,961 | $31,851 | $3,916 | $27,935 |
| 2018 | $9,097 | $29,381 | $3,405 | $25,976 |
| 2017 | $8,946 | $29,381 | $3,405 | $25,976 |
| 2016 | $8,612 | $29,381 | $3,405 | $25,976 |
| 2015 | $7,925 | $25,573 | $2,894 | $22,679 |
| 2014 | $7,819 | $25,573 | $2,894 | $22,679 |
| 2013 | $7,233 | $25,573 | $2,894 | $22,679 |
Source: Public Records
Map
Nearby Homes
- 413 Buffalo Trail Unit 10601
- 1637 Tahoe Circle Dr Unit 209
- 3400 N Buffalo Grove Rd
- 441 Commanche Trail Unit 3100
- 528 Surf Ct
- 314 Anthony Rd
- 1485 Chippewa Trail
- 200 Lake Blvd Unit 439
- 671 Cedarwood Ct Unit 2
- 175 Lake Blvd Unit 301
- 250 Lake Blvd Unit 218
- 3401 N Ellen Dr
- 691 Lakeside Circle Dr
- 150 Lake Blvd Unit 125
- 3026 Jackson Dr
- 1306 E Best Dr
- 705 Lakeside Circle Dr Unit 2
- 50 Lake Blvd Unit 632
- 416 Trinity Ct
- 100 Lake Blvd Unit 603
- 123 Selwyn Ln
- 1254 Eton Ct
- 415 Buffalo Trail Unit 10602
- 411 Buffalo Trail Unit 10306
- 417 Buffalo Trail Unit 10603
- 1246 Eton Ct
- 409 Buffalo Trail Unit 10305
- 419 Buffalo Trail Unit 10604
- 407 Buffalo Trail Unit 10304
- 1658 Tahoe Circle Dr Unit 201
- 1656 Tahoe Circle Dr Unit 201
- 405 Buffalo Trail Unit 10303
- 1760 Tahoe Circle Dr Unit 105
- 1715 Ashford Cir
- 1239 Eton Ct
- 1234 Eton Ct
- 1654 Tahoe Circle Dr Unit 201
- 143 Selwyn Ln
- 403 Buffalo Trail Unit 10302
- 1652 Tahoe Circle Dr Unit 201