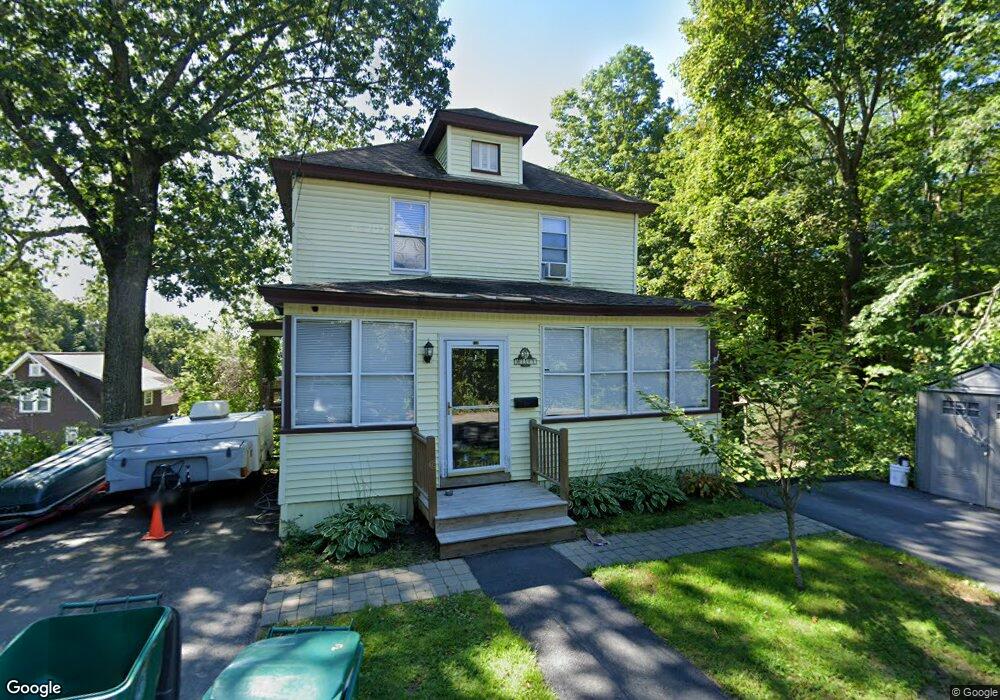
113 Simonds St Fitchburg, MA 01420
North of Main NeighborhoodEstimated Value: $326,000 - $432,000
3
Beds
2
Baths
1,496
Sq Ft
$241/Sq Ft
Est. Value
About This Home
This home is located at 113 Simonds St, Fitchburg, MA 01420 and is currently estimated at $360,445, approximately $240 per square foot. 113 Simonds St is a home located in Worcester County with nearby schools including Crocker Elementary School, South Street Elementary School, and Fitchburg High School.
Ownership History
Date
Name
Owned For
Owner Type
Purchase Details
Closed on
Aug 24, 2015
Sold by
Deluco David J
Bought by
Deluco David J and Deluco Heidi E
Current Estimated Value
Purchase Details
Closed on
Jan 19, 2001
Sold by
Lefevre Gerard J and Lefevre Sharon R
Bought by
Rogers Heidi E and Deluco David J
Home Financials for this Owner
Home Financials are based on the most recent Mortgage that was taken out on this home.
Original Mortgage
$111,600
Interest Rate
7.52%
Mortgage Type
Purchase Money Mortgage
Create a Home Valuation Report for This Property
The Home Valuation Report is an in-depth analysis detailing your home's value as well as a comparison with similar homes in the area
Home Values in the Area
Average Home Value in this Area
Purchase History
| Date | Buyer | Sale Price | Title Company |
|---|---|---|---|
| Deluco David J | -- | -- | |
| Rogers Heidi E | $117,500 | -- |
Source: Public Records
Mortgage History
| Date | Status | Borrower | Loan Amount |
|---|---|---|---|
| Previous Owner | Rogers Heidi E | $116,000 | |
| Previous Owner | Rogers Heidi E | $111,600 | |
| Previous Owner | Rogers Heidi E | $82,400 |
Source: Public Records
Tax History Compared to Growth
Tax History
| Year | Tax Paid | Tax Assessment Tax Assessment Total Assessment is a certain percentage of the fair market value that is determined by local assessors to be the total taxable value of land and additions on the property. | Land | Improvement |
|---|---|---|---|---|
| 2025 | $38 | $284,400 | $87,500 | $196,900 |
| 2024 | $3,710 | $250,500 | $53,900 | $196,600 |
| 2023 | $3,558 | $222,100 | $37,200 | $184,900 |
| 2022 | $3,400 | $193,100 | $40,600 | $152,500 |
| 2021 | $4,617 | $169,500 | $29,300 | $140,200 |
| 2020 | $2,770 | $159,500 | $27,100 | $132,400 |
| 2019 | $2,955 | $144,200 | $28,200 | $116,000 |
| 2018 | $2,838 | $135,100 | $25,900 | $109,200 |
| 2017 | $2,663 | $123,900 | $28,800 | $95,100 |
| 2016 | $2,605 | $122,700 | $27,700 | $95,000 |
| 2015 | $2,457 | $118,800 | $26,600 | $92,200 |
| 2014 | $2,354 | $118,700 | $26,600 | $92,100 |
Source: Public Records
Map
Nearby Homes
- 26 Taft St
- 26 Taft St
- 24 Taft St
- 114 Simonds St
- 27 Taft St
- 131 Simonds St
- 131 Simonds St Unit 1
- 131 Simonds St Unit First Floor
- 19 Taft St
- 0 Taft St
- 14 Taft St
- 134 Simonds St
- 87 Simonds St
- 78 Simonds St
- 8 Taft St Unit 1R
- 8 Taft St Unit 2
- 8 Taft St Unit 3
- 8 Taft St
- 10 Taft St Unit 2
- 10 Taft St Unit 1