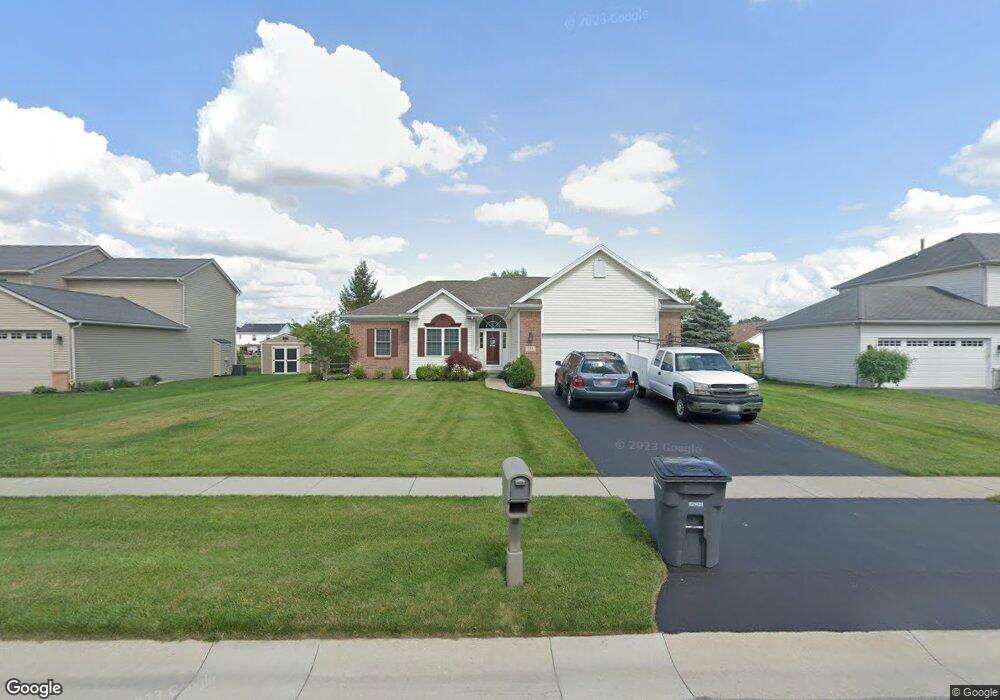
113 Springcove Ln Holland, OH 43528
Estimated Value: $304,000 - $338,000
3
Beds
2
Baths
1,600
Sq Ft
$201/Sq Ft
Est. Value
About This Home
This home is located at 113 Springcove Ln, Holland, OH 43528 and is currently estimated at $322,031, approximately $201 per square foot. 113 Springcove Ln is a home located in Lucas County with nearby schools including Dorr Street Elementary School, Springfield Middle School, and Springfield High School.
Ownership History
Date
Name
Owned For
Owner Type
Purchase Details
Closed on
Dec 1, 2005
Sold by
Murphy Harold J and Murphy Patricia A
Bought by
Mckown Barbara A
Current Estimated Value
Home Financials for this Owner
Home Financials are based on the most recent Mortgage that was taken out on this home.
Original Mortgage
$37,000
Outstanding Balance
$20,653
Interest Rate
6.25%
Mortgage Type
Fannie Mae Freddie Mac
Estimated Equity
$301,378
Purchase Details
Closed on
Aug 16, 1999
Sold by
J Moses Construction Ltd
Bought by
Murphy Harold J and Murphy Patricia A
Home Financials for this Owner
Home Financials are based on the most recent Mortgage that was taken out on this home.
Original Mortgage
$40,000
Interest Rate
7.77%
Purchase Details
Closed on
Mar 26, 1999
Sold by
Louisville Title Agency For Nw Ohio Inc
Bought by
J Moses Construction Ltd
Create a Home Valuation Report for This Property
The Home Valuation Report is an in-depth analysis detailing your home's value as well as a comparison with similar homes in the area
Home Values in the Area
Average Home Value in this Area
Purchase History
| Date | Buyer | Sale Price | Title Company |
|---|---|---|---|
| Mckown Barbara A | $183,000 | Chicago Title Insurance Co | |
| Murphy Harold J | $154,900 | Louisville Title Agency For | |
| J Moses Construction Ltd | $74,000 | Louisville Title Agency For |
Source: Public Records
Mortgage History
| Date | Status | Borrower | Loan Amount |
|---|---|---|---|
| Open | Mckown Barbara A | $37,000 | |
| Previous Owner | Murphy Harold J | $40,000 |
Source: Public Records
Tax History Compared to Growth
Tax History
| Year | Tax Paid | Tax Assessment Tax Assessment Total Assessment is a certain percentage of the fair market value that is determined by local assessors to be the total taxable value of land and additions on the property. | Land | Improvement |
|---|---|---|---|---|
| 2024 | $2,560 | $92,645 | $34,510 | $58,135 |
| 2023 | $4,563 | $73,570 | $28,035 | $45,535 |
| 2022 | $4,583 | $73,570 | $28,035 | $45,535 |
| 2021 | $4,312 | $73,570 | $28,035 | $45,535 |
| 2020 | $4,194 | $65,905 | $20,160 | $45,745 |
| 2019 | $4,098 | $65,905 | $20,160 | $45,745 |
| 2018 | $4,039 | $65,905 | $20,160 | $45,745 |
| 2017 | $4,270 | $64,400 | $19,705 | $44,695 |
| 2016 | $5,587 | $233,000 | $56,300 | $176,700 |
| 2015 | $967 | $56,300 | $56,300 | $0 |
| 2014 | $3,358 | $56,600 | $18,940 | $37,660 |
| 2013 | $3,358 | $56,600 | $18,940 | $37,660 |
Source: Public Records
Map
Nearby Homes
- 7709 Fountain Dr
- 7909 Hill Ave
- 7944 Hill Ave
- 68 Hidden Meadow Dr
- 8006 Cove Harbour Dr N
- 7920 N Shoreline Dr
- 8046 Lea Ct
- 134 Deerfield Dr
- 7238 Lilac Ct
- 7256 Apache Trail
- 7331 Witherby Ct
- 226 Perrine St
- 820 Weatherstone Rd
- 217 Pebble Beach Dr
- 8435 Willow Glen Ct
- 7111 Nebraska Ave
- 215 Stone Oak Ct
- 44 Treetop Place
- 540 S Centennial Rd
- 8553 Stone Oak Dr
- 105 Springcove Ln
- 121 Springcove Ln
- 49 Springcove Ln
- 129 Springcove Ln
- 7730 Hidden Springs Dr
- 7722 Hidden Springs Dr
- 114 Fountain Dr
- 104 Fountain Dr
- 116 Springcove Ln
- 108 Springcove Ln
- 41 Springcove Ln
- 124 Springcove Ln
- 100 Springcove Ln
- 48 Fountain Dr
- 122 Fountain Dr
- 7729 Spring Haven Dr
- 132 Springcove Ln
- 46 Springcove Ln
- 130 Fountain Dr
- 7721 Spring Haven Dr