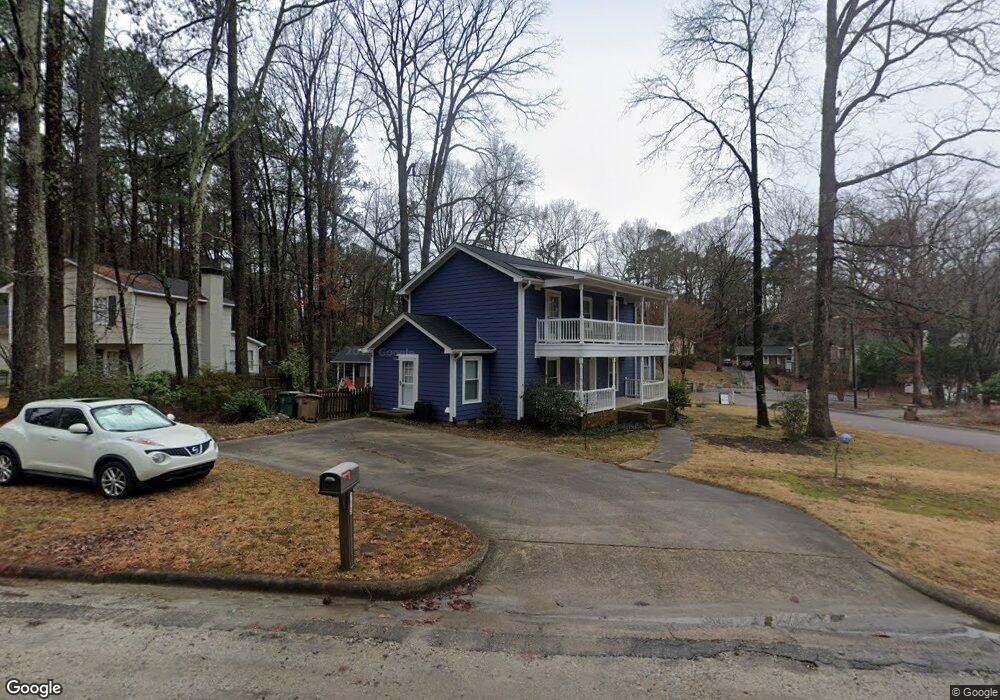
113 Sycamore St Cary, NC 27513
South Cary NeighborhoodEstimated Value: $462,000 - $489,247
4
Beds
3
Baths
1,839
Sq Ft
$257/Sq Ft
Est. Value
About This Home
This home is located at 113 Sycamore St, Cary, NC 27513 and is currently estimated at $473,062, approximately $257 per square foot. 113 Sycamore St is a home located in Wake County with nearby schools including Weatherstone Elementary School, East Cary Middle School, and Cary High School.
Ownership History
Date
Name
Owned For
Owner Type
Purchase Details
Closed on
Jul 29, 2016
Sold by
Sandwick Thomas J and Sandwick Chrsitine L
Bought by
Ralston Shayne and Ralston Chelsea
Current Estimated Value
Home Financials for this Owner
Home Financials are based on the most recent Mortgage that was taken out on this home.
Original Mortgage
$182,000
Outstanding Balance
$83,463
Interest Rate
3.54%
Mortgage Type
New Conventional
Estimated Equity
$389,599
Purchase Details
Closed on
Sep 3, 1996
Bought by
Sandwick Thomas J and Sandwick Hristine L
Create a Home Valuation Report for This Property
The Home Valuation Report is an in-depth analysis detailing your home's value as well as a comparison with similar homes in the area
Home Values in the Area
Average Home Value in this Area
Purchase History
| Date | Buyer | Sale Price | Title Company |
|---|---|---|---|
| Ralston Shayne | $232,000 | None Available | |
| Sandwick Thomas J | $129,000 | -- |
Source: Public Records
Mortgage History
| Date | Status | Borrower | Loan Amount |
|---|---|---|---|
| Open | Ralston Shayne | $182,000 |
Source: Public Records
Tax History Compared to Growth
Tax History
| Year | Tax Paid | Tax Assessment Tax Assessment Total Assessment is a certain percentage of the fair market value that is determined by local assessors to be the total taxable value of land and additions on the property. | Land | Improvement |
|---|---|---|---|---|
| 2025 | $3,863 | $448,345 | $210,000 | $238,345 |
| 2024 | $3,779 | $448,345 | $210,000 | $238,345 |
| 2023 | $3,043 | $301,716 | $120,000 | $181,716 |
| 2022 | $2,930 | $301,716 | $120,000 | $181,716 |
| 2021 | $2,871 | $301,716 | $120,000 | $181,716 |
| 2020 | $2,886 | $301,716 | $120,000 | $181,716 |
| 2019 | $2,240 | $207,366 | $68,000 | $139,366 |
| 2018 | $2,103 | $207,366 | $68,000 | $139,366 |
| 2017 | $2,021 | $207,366 | $68,000 | $139,366 |
| 2016 | $0 | $193,198 | $68,000 | $125,198 |
| 2015 | -- | $182,411 | $56,000 | $126,411 |
| 2014 | -- | $182,411 | $56,000 | $126,411 |
Source: Public Records
Map
Nearby Homes
- 117 Red Bud Ct
- 213 Howland Ave
- 101 Murphy Dr
- 534 Matheson Place
- 102 Joel Ct
- 204 Phauff Ct
- 101 Joel Ct
- 114 Canterfield Rd
- 143 Hedgerow Ct
- 207 High House Rd
- 316 Howland Ave
- 209 High House Rd
- 710 Samuel Cary Dr
- 1017 Frank Page Dr
- 1009 Contessa Dr
- 1149 Contessa Dr
- 432 W Park St
- 206 Vista Creek Place
- 631 Springfork Dr Unit 5C3
- 415 W Chatham St
- 109 Sycamore St
- 131 Sycamore St
- 107 Sycamore St
- 119 Red Bud Ct
- 112 Sycamore St
- 110 Sycamore St
- 129 Red Bud Ct
- 130 Sycamore St
- 106 Sycamore St
- 105 Sycamore St
- 125 Red Bud Ct
- 121 Red Bud Ct
- 102 Sycamore St
- 123 Red Bud Ct
- 133 Sycamore St
- 103 Sycamore St
- 140 Sycamore St
- 207 Howland Ave
- 215 Howland Ave
- 205 Howland Ave