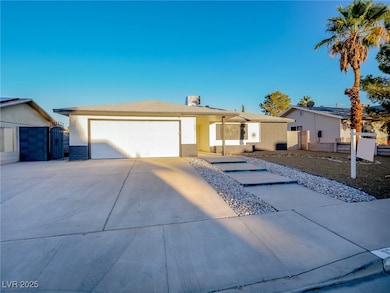
113 Thunder St Las Vegas, NV 89145
Charleston Preservation NeighborhoodEstimated payment $2,422/month
Highlights
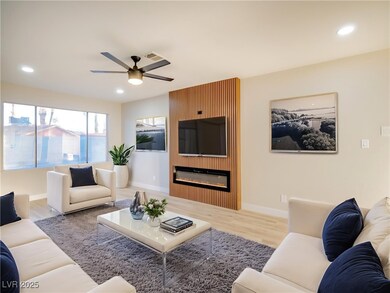
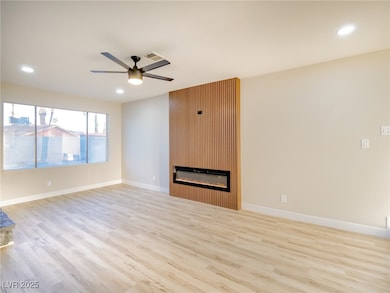
- Living Room with Fireplace
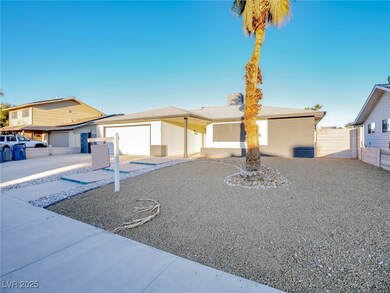
- 2 Car Attached Garage
- Luxury Vinyl Plank Tile Flooring
- No HOA
- Desert Landscape
- Central Heating and Cooling System
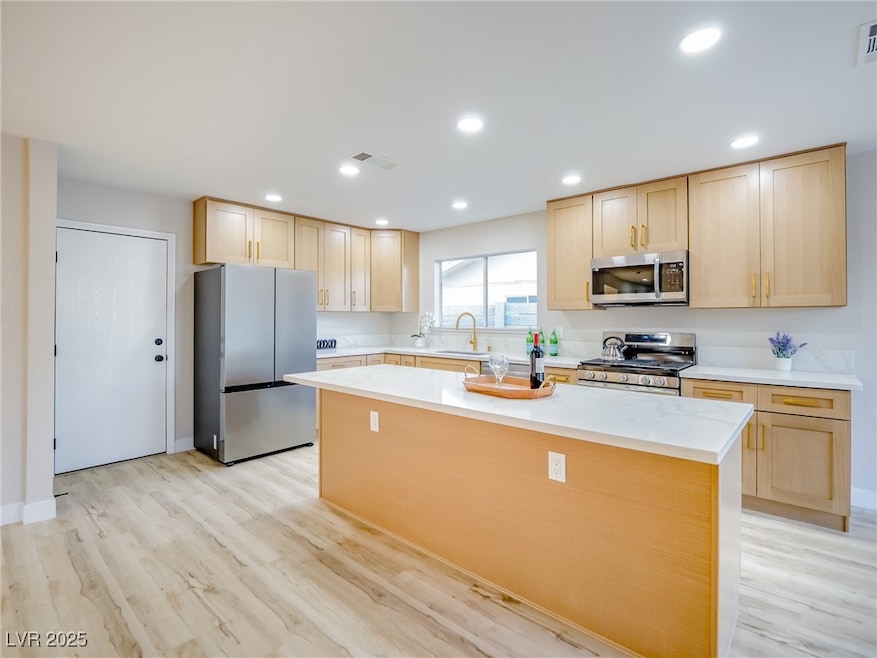
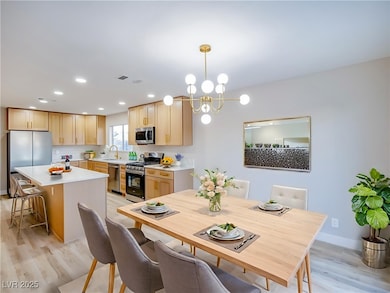
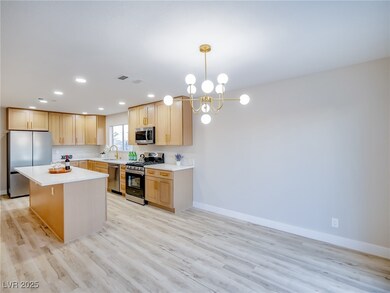
About This Home
Step into modern luxury with this fully remodeled 3-bedroom, 2-bath home featuring an open-concept layout designed for both comfort and style. The stunning kitchen showcases sleek quartz countertops, a spacious island perfect for dining and entertaining, and upgraded cabinetry with contemporary finishes. Natural light fills the living areas, highlighting the fresh paint, new flooring, and thoughtfully selected fixtures throughout. The primary suite offers a beautifully updated bathroom with Luxury Vinyl Plank work and modern touches. Both secondary bedrooms are versatile for guests, an office, or a flex space. Enjoy the convenience of a 2-car garage providing ample parking and storage. With every detail carefully updated, this move-in-ready home blends functionality with designer appeal, creating the perfect setting for everyday living or hosting. Located close to parks, schools, and shopping. This turn-key home combines comfort, space, and style ready for you to move in and enjoy!
Listing Agent
Galindo Group Real Estate Brokerage Email: dinozenuni@gmail.com License #S.0180566 Listed on: 10/21/2025
Home Details
Home Type
- Single Family
Est. Annual Taxes
- $1,230
Year Built
- Built in 1976
Lot Details
- 6,970 Sq Ft Lot
- West Facing Home
- Back Yard Fenced
- Block Wall Fence
- Desert Landscape
- Artificial Turf
Parking
- 2 Car Attached Garage
Home Design
- Frame Construction
- Shingle Roof
- Composition Roof
- Stucco
Interior Spaces
- 1,620 Sq Ft Home
- 1-Story Property
- Ceiling Fan
- Electric Fireplace
- Gas Fireplace
- Living Room with Fireplace
- 2 Fireplaces
Kitchen
- Gas Range
- Microwave
- Dishwasher
- Disposal
Flooring
- Carpet
- Luxury Vinyl Plank Tile
Bedrooms and Bathrooms
- 3 Bedrooms
Laundry
- Laundry on main level
- Gas Dryer Hookup
Schools
- Smith Elementary School
- Johnson Walter Middle School
- Bonanza High School
Utilities
- Central Heating and Cooling System
- Heating System Uses Gas
- Underground Utilities
Community Details
- No Home Owners Association
- Charleston Rainbow Subdivision
Map
Home Values in the Area
Average Home Value in this Area
Tax History
| Year | Tax Paid | Tax Assessment Tax Assessment Total Assessment is a certain percentage of the fair market value that is determined by local assessors to be the total taxable value of land and additions on the property. | Land | Improvement |
|---|---|---|---|---|
| 2025 | $1,520 | $59,229 | $35,350 | $23,879 |
| 2024 | $1,195 | $59,229 | $35,350 | $23,879 |
| 2023 | $1,195 | $58,667 | $34,650 | $24,017 |
| 2022 | $1,163 | $51,600 | $29,050 | $22,550 |
| 2021 | $1,130 | $48,272 | $26,250 | $22,022 |
| 2020 | $1,094 | $47,240 | $24,850 | $22,390 |
| 2019 | $1,062 | $43,896 | $21,350 | $22,546 |
| 2018 | $1,031 | $40,942 | $18,900 | $22,042 |
| 2017 | $1,263 | $39,860 | $17,150 | $22,710 |
| 2016 | $977 | $36,988 | $13,300 | $23,688 |
| 2015 | $974 | $34,312 | $10,500 | $23,812 |
| 2014 | $946 | $29,700 | $6,300 | $23,400 |
Property History
| Date | Event | Price | List to Sale | Price per Sq Ft |
|---|---|---|---|---|
| 10/27/2025 10/27/25 | Pending | -- | -- | -- |
| 10/21/2025 10/21/25 | For Sale | $439,900 | -- | $272 / Sq Ft |
Purchase History
| Date | Type | Sale Price | Title Company |
|---|---|---|---|
| Bargain Sale Deed | $312,000 | Equity Title | |
| Bargain Sale Deed | $290,000 | Equity Title |
Source: Las Vegas REALTORS®
MLS Number: 2728883
APN: 138-34-115-013
Disclaimer: Certain information contained herein is derived from information provided by parties other than Homes.com. All information provided is deemed reliable, but is not guaranteed to be accurate and should be independently verified.
![]() The data relating to real estate for sale on this web site comes in part from the INTERNET DATA EXCHANGE Program of the Greater Las Vegas Association of REALTORS® MLS. Real estate listings held by brokerage firms other than this site owner are marked with the IDX logo. Information is deemed reliable but not guaranteed. Copyright 2025 of the Greater Las Vegas Association of REALTORS® MLS. All rights reserved.
The data relating to real estate for sale on this web site comes in part from the INTERNET DATA EXCHANGE Program of the Greater Las Vegas Association of REALTORS® MLS. Real estate listings held by brokerage firms other than this site owner are marked with the IDX logo. Information is deemed reliable but not guaranteed. Copyright 2025 of the Greater Las Vegas Association of REALTORS® MLS. All rights reserved.
- 7100 Raincloud Dr
- 108 Antelope Way
- 116 Lotus Blossom Ct
- 121 Fig Ct
- 200 Fig Ct
- 7121 Hurricane Way
- 7220 Stormson Dr
- 7024 Pinedale Ave
- 101 Bahama Rd
- 6949 Cobblestone Ave
- 7100 Pirates Cove Rd Unit 1045
- 7100 Pirates Cove Rd Unit 2008
- 7100 Pirates Cove Rd Unit 1049
- 7100 Pirates Cove Rd Unit 2082
- 217 Yardarm Way
- 216 Yardarm Way
- 7200 Pirates Cove Rd Unit 2019
- 7200 Pirates Cove Rd Unit 2039
- 7200 Pirates Cove Rd Unit 2029
- 7200 Pirates Cove Rd Unit 2004
