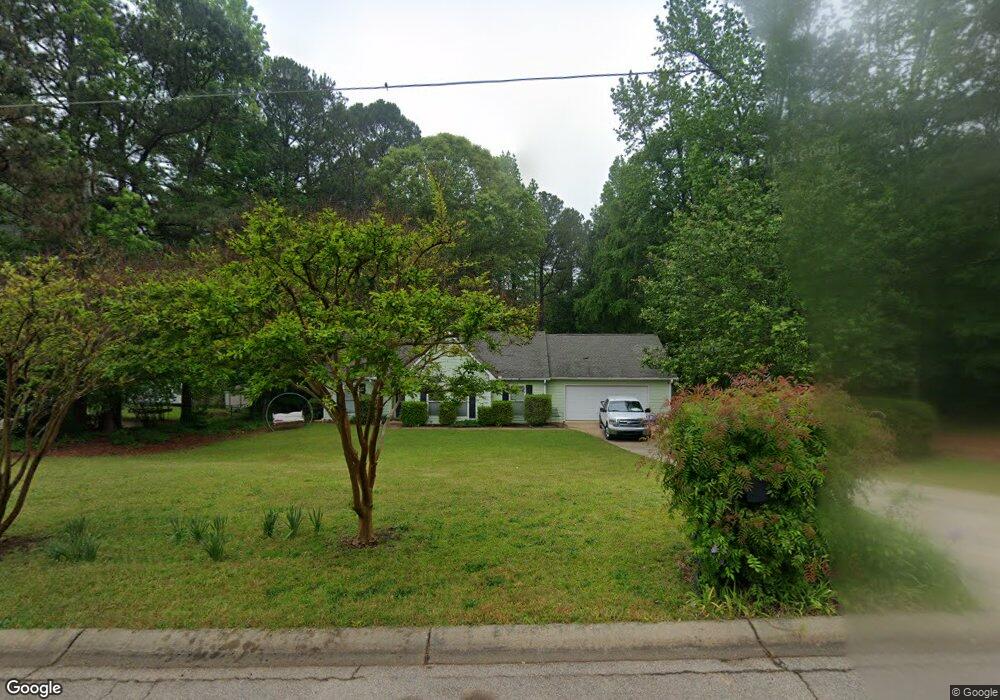
113 Twelve Oaks Dr Lagrange, GA 30241
Estimated Value: $222,606 - $256,000
3
Beds
2
Baths
1,512
Sq Ft
$158/Sq Ft
Est. Value
About This Home
This home is located at 113 Twelve Oaks Dr, Lagrange, GA 30241 and is currently estimated at $238,902, approximately $158 per square foot. 113 Twelve Oaks Dr is a home located in Troup County with nearby schools including Callaway Elementary School, Hogansville Elementary School, and Callaway Middle School.
Ownership History
Date
Name
Owned For
Owner Type
Purchase Details
Closed on
Aug 18, 2022
Sold by
Bowen Justin
Bought by
Smith Whitney F
Current Estimated Value
Purchase Details
Closed on
Sep 7, 2017
Sold by
Bolnick Alison
Bought by
Bowen Justin and Smith Whitney F
Home Financials for this Owner
Home Financials are based on the most recent Mortgage that was taken out on this home.
Original Mortgage
$130,295
Interest Rate
3.87%
Mortgage Type
FHA
Purchase Details
Closed on
Feb 26, 1997
Sold by
Passarella Rene
Bought by
Bolnick Alison
Purchase Details
Closed on
Oct 2, 1995
Sold by
Brown Wende Leigh
Bought by
Passarella Rene
Purchase Details
Closed on
Dec 30, 1993
Sold by
Dan Ric
Bought by
Brown Wende Leigh
Purchase Details
Closed on
Nov 7, 1990
Bought by
Dan Ric
Create a Home Valuation Report for This Property
The Home Valuation Report is an in-depth analysis detailing your home's value as well as a comparison with similar homes in the area
Home Values in the Area
Average Home Value in this Area
Purchase History
| Date | Buyer | Sale Price | Title Company |
|---|---|---|---|
| Smith Whitney F | -- | -- | |
| Bowen Justin | $132,700 | -- | |
| Bolnick Alison | $82,500 | -- | |
| Passarella Rene | $74,500 | -- | |
| Brown Wende Leigh | $70,800 | -- | |
| Dan Ric | -- | -- |
Source: Public Records
Mortgage History
| Date | Status | Borrower | Loan Amount |
|---|---|---|---|
| Previous Owner | Bowen Justin | $130,295 |
Source: Public Records
Tax History Compared to Growth
Tax History
| Year | Tax Paid | Tax Assessment Tax Assessment Total Assessment is a certain percentage of the fair market value that is determined by local assessors to be the total taxable value of land and additions on the property. | Land | Improvement |
|---|---|---|---|---|
| 2024 | $1,781 | $67,292 | $10,000 | $57,292 |
| 2023 | $1,672 | $63,300 | $10,000 | $53,300 |
| 2022 | $1,608 | $59,620 | $10,000 | $49,620 |
| 2021 | $1,585 | $54,552 | $8,000 | $46,552 |
| 2020 | $1,585 | $54,552 | $8,000 | $46,552 |
| 2019 | $1,506 | $51,924 | $6,000 | $45,924 |
| 2018 | $1,506 | $51,924 | $6,000 | $45,924 |
| 2017 | $1,367 | $47,324 | $6,000 | $41,324 |
| 2016 | $1,334 | $46,209 | $6,000 | $40,209 |
| 2015 | $1,314 | $45,484 | $6,000 | $39,484 |
| 2014 | $1,254 | $43,406 | $6,000 | $37,406 |
| 2013 | -- | $36,325 | $6,000 | $30,325 |
Source: Public Records
Map
Nearby Homes
- 91 Almond Rd
- 453 E Mount Zion Church Rd
- 425 Mount Zion Church Rd
- 142 Carr Rd
- 286 Hines Rd
- 547 Hines Rd
- Cypress Plan at Antler Ridge
- 106 Beaver Run
- 2477 Upper Big Springs Rd
- 228 Sivell Rd
- 132 Hines Rd
- 810 Callaway Church Rd
- 0 Hines Rd Unit 10488606
- 10 Whitfield Rd
- 229 Big Springs Mountville Rd
- 200 River Meadow Dr
- 234 River Meadow Dr
- 4117 Greenville Rd
- 313 Mourning Ct Unit LOT 32
- 311 Mourning Ct Unit LOT 33
- 115 Twelve Oaks Dr
- 111 Twelve Oaks Dr
- 117 Twelve Oaks Dr
- 109 Twelve Oaks Dr
- 116 Twelve Oaks Dr
- 116 Twelve Oaks Dr Unit II
- 114 Twelve Oaks Dr
- 107 Twelve Oaks Dr
- 112 Twelve Oaks Dr
- 119 Twelve Oaks Dr
- 118 Twelve Oaks Dr
- 120 Twelve Oaks Dr
- 110 Twelve Oaks Dr
- 105 Twelve Oaks Dr
- 122 Twelve Oaks Dr
- 121 Twelve Oaks Dr
- 108 Twelve Oaks Dr
- 103 Twelve Oaks Dr
- 123 Twelve Oaks Dr
- 124 Twelve Oaks Dr