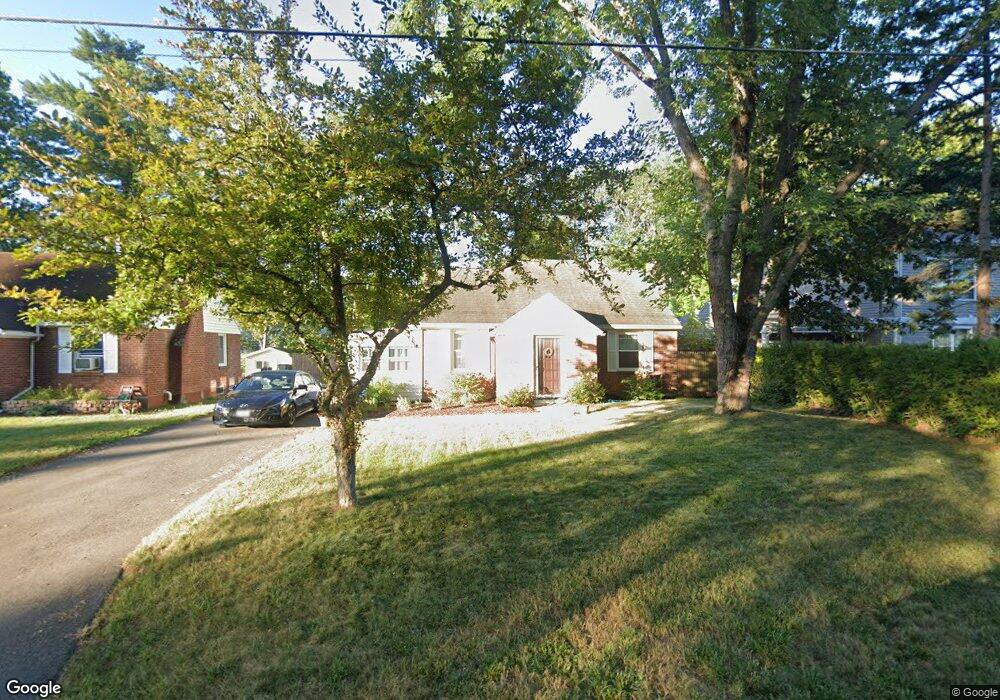
113 Vaughn Dr Albany, NY 12203
Estimated Value: $282,000 - $327,000
3
Beds
1
Bath
1,495
Sq Ft
$203/Sq Ft
Est. Value
About This Home
This home is located at 113 Vaughn Dr, Albany, NY 12203 and is currently estimated at $302,755, approximately $202 per square foot. 113 Vaughn Dr is a home located in Albany County with nearby schools including Westmere Elementary School, Farnsworth Middle School, and Guilderland High School.
Ownership History
Date
Name
Owned For
Owner Type
Purchase Details
Closed on
Oct 7, 2010
Sold by
Martin Patricia and Freese Patricia
Bought by
Gaglio Rita M
Current Estimated Value
Home Financials for this Owner
Home Financials are based on the most recent Mortgage that was taken out on this home.
Original Mortgage
$162,807
Outstanding Balance
$108,902
Interest Rate
4.62%
Mortgage Type
FHA
Estimated Equity
$193,853
Purchase Details
Closed on
Jan 25, 2002
Sold by
Czub Jacqueline M
Bought by
Martin Patricia
Create a Home Valuation Report for This Property
The Home Valuation Report is an in-depth analysis detailing your home's value as well as a comparison with similar homes in the area
Home Values in the Area
Average Home Value in this Area
Purchase History
| Date | Buyer | Sale Price | Title Company |
|---|---|---|---|
| Gaglio Rita M | $165,000 | Chicago Title Insurance Co | |
| Martin Patricia | $107,000 | Susan A. Hoblock |
Source: Public Records
Mortgage History
| Date | Status | Borrower | Loan Amount |
|---|---|---|---|
| Open | Gaglio Rita M | $162,807 |
Source: Public Records
Tax History Compared to Growth
Tax History
| Year | Tax Paid | Tax Assessment Tax Assessment Total Assessment is a certain percentage of the fair market value that is determined by local assessors to be the total taxable value of land and additions on the property. | Land | Improvement |
|---|---|---|---|---|
| 2024 | $5,357 | $179,000 | $36,000 | $143,000 |
| 2023 | $5,192 | $179,000 | $36,000 | $143,000 |
| 2022 | $4,579 | $179,000 | $36,000 | $143,000 |
| 2021 | $4,421 | $179,000 | $36,000 | $143,000 |
| 2020 | $4,365 | $179,000 | $36,000 | $143,000 |
| 2019 | $3,850 | $179,000 | $36,000 | $143,000 |
| 2018 | $3,646 | $138,900 | $27,800 | $111,100 |
| 2017 | $0 | $138,900 | $27,800 | $111,100 |
| 2016 | $4,235 | $138,900 | $27,800 | $111,100 |
| 2015 | -- | $138,900 | $27,800 | $111,100 |
| 2014 | -- | $138,900 | $27,800 | $111,100 |
Source: Public Records
Map
Nearby Homes