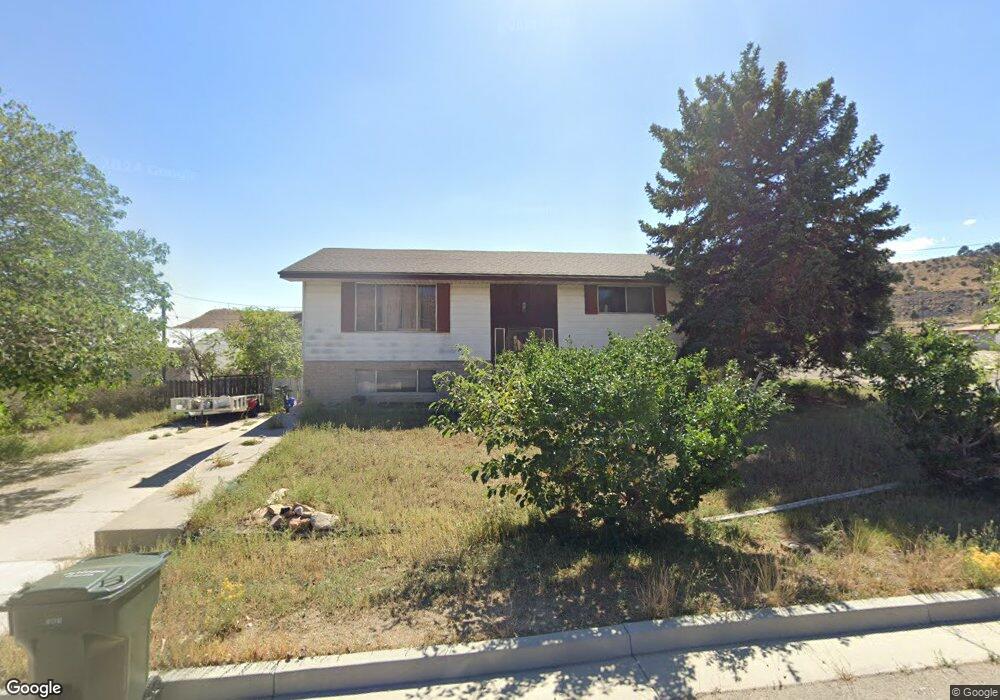
113 W 200 N Helper, UT 84526
Estimated Value: $378,000 - $651,000
4
Beds
2
Baths
2,132
Sq Ft
$220/Sq Ft
Est. Value
About This Home
This home is located at 113 W 200 N, Helper, UT 84526 and is currently estimated at $468,779, approximately $219 per square foot. 113 W 200 N is a home located in Carbon County with nearby schools including Sally Mauro School, Helper Junior High School, and Carbon High School.
Ownership History
Date
Name
Owned For
Owner Type
Purchase Details
Closed on
Mar 5, 2021
Sold by
Nielsen Scott D and Nielsen Scott
Bought by
Sharp David Elvis
Current Estimated Value
Home Financials for this Owner
Home Financials are based on the most recent Mortgage that was taken out on this home.
Original Mortgage
$232,500
Interest Rate
2.7%
Mortgage Type
New Conventional
Purchase Details
Closed on
Mar 4, 2021
Sold by
Nielsen Julie and Nielsen Julie M
Bought by
Nielsen Scott D and Nielsen Scott
Home Financials for this Owner
Home Financials are based on the most recent Mortgage that was taken out on this home.
Original Mortgage
$232,500
Interest Rate
2.7%
Mortgage Type
New Conventional
Purchase Details
Closed on
Mar 16, 2010
Sold by
Elegante Charles and Elegante Charmaine
Bought by
Elegante Charles and Elegante Charmaine
Create a Home Valuation Report for This Property
The Home Valuation Report is an in-depth analysis detailing your home's value as well as a comparison with similar homes in the area
Home Values in the Area
Average Home Value in this Area
Purchase History
| Date | Buyer | Sale Price | Title Company |
|---|---|---|---|
| Sharp David Elvis | -- | South Eastern Utah Ttl Compa | |
| Nielsen Scott D | -- | South Eastern Utah Ttl Compa | |
| Elegante Charles | -- | None Available |
Source: Public Records
Mortgage History
| Date | Status | Borrower | Loan Amount |
|---|---|---|---|
| Open | Sharp David Elvis | $320,000 | |
| Closed | Sharp David Elvis | $320,000 | |
| Closed | Sharp David Elvis | $232,500 | |
| Previous Owner | Nielsen Scott D | $168,000 |
Source: Public Records
Tax History Compared to Growth
Tax History
| Year | Tax Paid | Tax Assessment Tax Assessment Total Assessment is a certain percentage of the fair market value that is determined by local assessors to be the total taxable value of land and additions on the property. | Land | Improvement |
|---|---|---|---|---|
| 2024 | $2,537 | $198,301 | $29,398 | $168,903 |
| 2023 | $2,754 | $218,016 | $30,346 | $187,670 |
| 2022 | $2,352 | $175,308 | $26,587 | $148,721 |
| 2021 | $2,174 | $257,049 | $38,984 | $218,065 |
| 2020 | $1,905 | $114,130 | $0 | $0 |
| 2019 | $1,395 | $102,231 | $0 | $0 |
| 2018 | $1,357 | $102,231 | $0 | $0 |
| 2017 | $1,432 | $109,455 | $0 | $0 |
| 2016 | $1,281 | $109,455 | $0 | $0 |
| 2015 | $1,281 | $109,455 | $0 | $0 |
| 2014 | $1,261 | $109,455 | $0 | $0 |
| 2013 | $1,272 | $109,455 | $0 | $0 |
Source: Public Records
Map
Nearby Homes