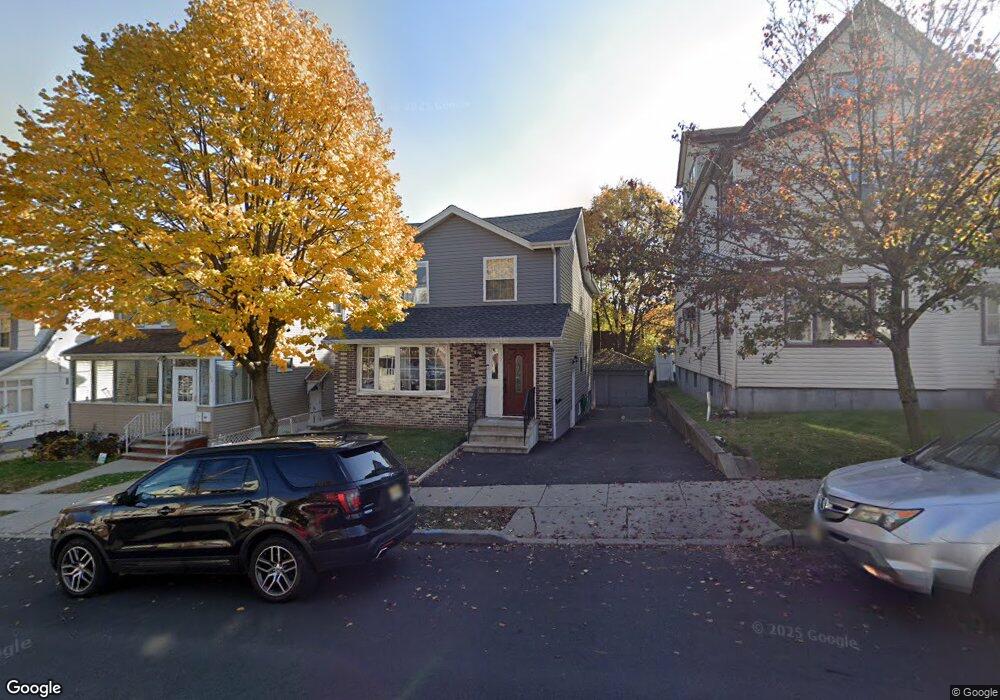
113 W 3rd St Clifton, NJ 07011
Hazel NeighborhoodEstimated Value: $420,000 - $787,000
--
Bed
--
Bath
2,184
Sq Ft
$293/Sq Ft
Est. Value
About This Home
This home is located at 113 W 3rd St, Clifton, NJ 07011 and is currently estimated at $639,486, approximately $292 per square foot. 113 W 3rd St is a home located in Passaic County with nearby schools including Clifton High School, Paterson Charter School for Science & Technology, and Njedda Elementary School.
Ownership History
Date
Name
Owned For
Owner Type
Purchase Details
Closed on
May 31, 2023
Sold by
Gr Investors Group Llc
Bought by
Garre Capital Group Llc
Current Estimated Value
Home Financials for this Owner
Home Financials are based on the most recent Mortgage that was taken out on this home.
Original Mortgage
$475,000
Outstanding Balance
$462,391
Interest Rate
6.43%
Mortgage Type
New Conventional
Estimated Equity
$177,095
Purchase Details
Closed on
Mar 5, 2018
Sold by
S E M Realty Inc and Macko Steve
Bought by
Gr Invesgtros Group Llc
Purchase Details
Closed on
Jun 9, 2009
Sold by
Macko Steven
Bought by
S E M Realty Inc
Purchase Details
Closed on
Aug 14, 2002
Sold by
Sem Realty Inc
Bought by
Macko Steven
Create a Home Valuation Report for This Property
The Home Valuation Report is an in-depth analysis detailing your home's value as well as a comparison with similar homes in the area
Home Values in the Area
Average Home Value in this Area
Purchase History
| Date | Buyer | Sale Price | Title Company |
|---|---|---|---|
| Garre Capital Group Llc | -- | None Listed On Document | |
| Gr Invesgtros Group Llc | $230,000 | None Available | |
| S E M Realty Inc | $222,175 | -- | |
| Macko Steven | -- | -- |
Source: Public Records
Mortgage History
| Date | Status | Borrower | Loan Amount |
|---|---|---|---|
| Open | Garre Capital Group Llc | $475,000 |
Source: Public Records
Tax History Compared to Growth
Tax History
| Year | Tax Paid | Tax Assessment Tax Assessment Total Assessment is a certain percentage of the fair market value that is determined by local assessors to be the total taxable value of land and additions on the property. | Land | Improvement |
|---|---|---|---|---|
| 2025 | $11,094 | $186,900 | $72,200 | $114,700 |
| 2024 | $10,829 | $186,900 | $72,200 | $114,700 |
| 2023 | $10,672 | $186,900 | $72,200 | $114,700 |
| 2022 | $10,672 | $186,900 | $72,200 | $114,700 |
| 2021 | $10,233 | $186,900 | $72,200 | $114,700 |
| 2020 | $10,266 | $186,900 | $72,200 | $114,700 |
| 2019 | $5,209 | $95,500 | $72,200 | $23,300 |
| 2018 | $5,179 | $95,500 | $72,200 | $23,300 |
| 2017 | $5,123 | $95,500 | $72,200 | $23,300 |
| 2016 | $5,023 | $95,500 | $72,200 | $23,300 |
| 2015 | $4,975 | $95,500 | $72,200 | $23,300 |
| 2014 | $4,872 | $95,500 | $72,200 | $23,300 |
Source: Public Records
Map
Nearby Homes
- 112 W 3rd St
- 170 W 4th St
- 179 W 3rd St
- 28 High Park Place
- 107 Vreeland Ave
- 24 6th Ave
- 218 W 2nd St
- 71 Fernwood Ct
- 92 Wabash Ave
- 165 E 2nd St
- 275 E 7th St
- 432 Trenton Ave Unit 14 A
- 432 Trenton Ave
- 432-434 Trenton Ave Unit 14A
- 432-434 Trenton Ave Unit 7
- 366 Trenton Ave Unit 4F
- 366-2-382 Trenton Ave Unit 5D
- 366-2-382 Trenton Ave Unit 5B
- 356 3rd St